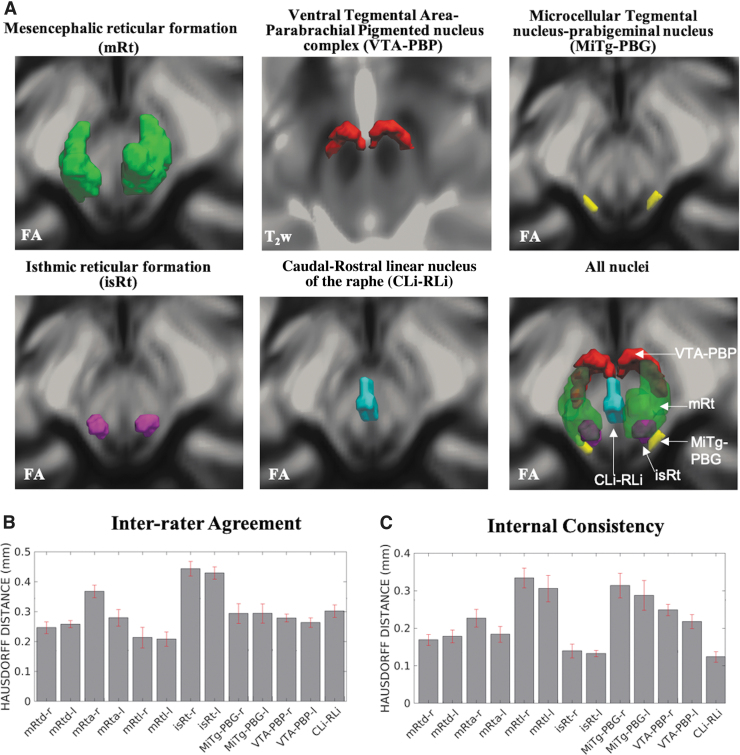
FIG. 6.
(A) 3D rendering of our nucleus labels of the entire mRt, isRt, MiTg-PBG, VTA-PBP, and CLi-RLi in the MNI space and of all the nuclei. As a background image, we used the FA map in the MNI space, except for VTA-PBP, for which we used the T2w image in the MNI space. The 3D rendering was achieved by the use of ITK-SNAP, v. 3.8.0 (Yushkevich et al., 2006), and ParaView, v. 5.9.0 (Ayachit, 2015); images were mildly rotated in the left/right direction to also display the nucleus label depth. (B, C) Atlas validation. (B) The inter-rater agreement of nucleus segmentation (bar/error bar = mean/SE modified Hausdorff distance across 12 subjects). (C) The internal consistency of nucleus labels across subjects (bar/error bar = mean/SE modified Hausdorff distance across 12 subjects). The labels of the mRtd-r/l, mRta-r/l, mRtl-r/l, isRt-r/l, MiTg-PBG-r/l, VTA-PBP-r/l, and CLi-RLi displayed good spatial overlap across raters and subjects (the modified Hausdorff distance was smaller than the spatial imaging resolution, p < 0.05), thus validating the probabilistic nucleus atlas. 3D, three-dimensional; SE, standard error.

