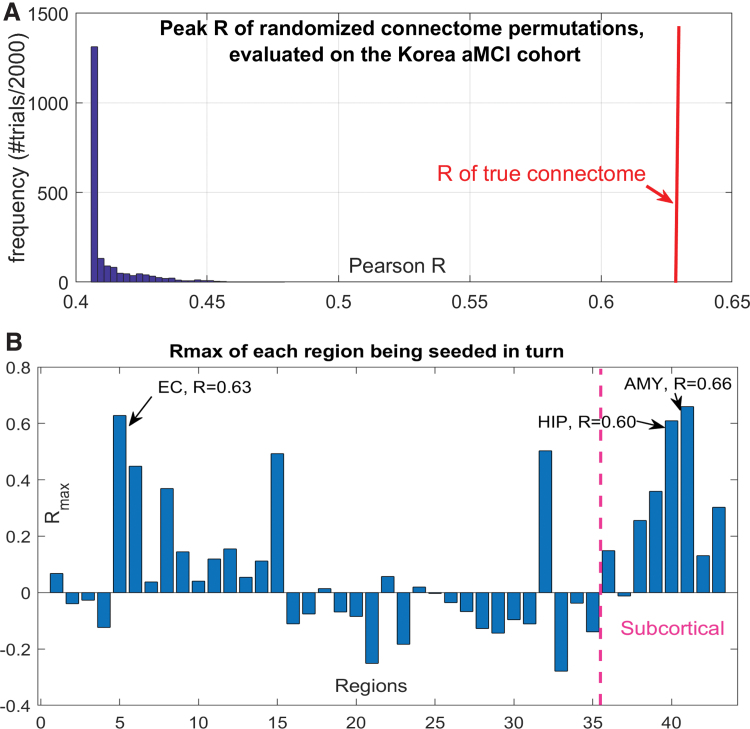
FIG. 5.
AND simulations at different seedings and connectomes. (A) Histogram of peak Pearson's R achieved by AND over 2000 trials of randomly scrambled connectivity matrices. For comparison, the true network's R is shown by the vertical red line. (B) Bar chart of repeated seeding of each region in turn. For each seed region, peak Pearson's R over model time, corresponding to the correlation between model and amnestic MCI τ positron emission tomography data from the Korea cohort, is shown. EC, amygdala and hippocampus are the three best seed regions; EC is the best cortical seed. AMY, amygdale; HIP, hippocampus. Color images are available online.

