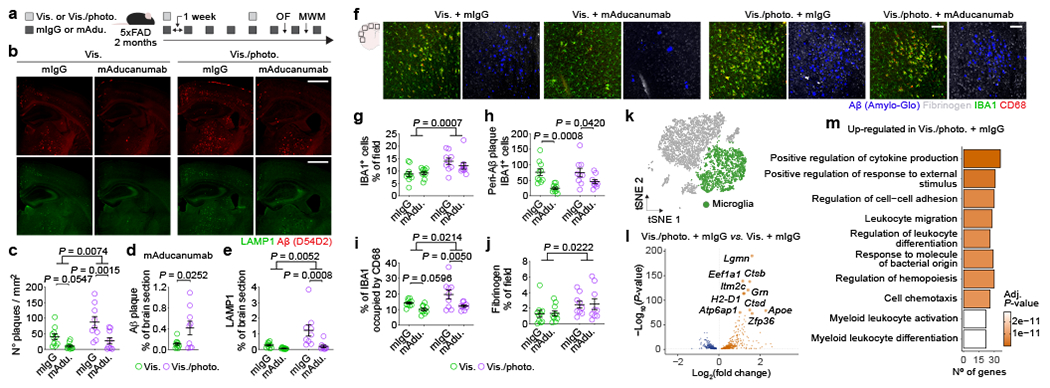
Figure 1 |. Compromised meningeal lymphatic function in 5xFAD mice limits brain Aβ clearance by chimeric murine Aducanumab and modulates the microglial and neurovascular responses.

a, Experimental scheme involving 2-month-old male 5xFAD mice (behavior testing in Extended Data Fig. 4); intra-cisterna magna (i.c.m.), intraperitoneal (i.p.), Visudyne plus photoconversion (Vis./photo.) or without photoconversion (Vis.). b, Representative images of brain stained for Aβ (red, with D54D2 antibody) and LAMP1 (green; scale bars, 1 mm). c-e, Graphs showing c) number of Aβ plaques per mm2, d) Aβ coverage and e) LAMP1 coverage. f, Representative images of brain stained for Aβ (blue, with Amilo-Glo), fibrinogen (grey), IBA1 (green) and CD68 (red; scale bars, 100 μm). g-j, Graphs showing g) IBA1 coverage, h) peri-Aβ IBA1+ cells, i) percentage of IBA1 occupied by CD68 and j) fibrinogen coverage. Results in c-e and g-j are presented as mean ± s.e.m.; n = 10 in Vis. groups and n = 9 in Vis./photo. groups; in c, e and g-j, two-way ANOVA with Holm-Sidak’s multiple comparisons test; in d, two-tailed unpaired Student’s T test; data in a-j is representative of one experiment; see Extended Data Fig. 3f–q for similar data using chimeric mAb158. k, Transcriptomes of enriched brain cells analyzed by single-cell RNA-seq. t-Distributed stochastic neighbor embedding (tSNE) plot highlighting microglia (in green). l, Volcano plot with significantly down-regulated and up-regulated genes in microglia from Vis./photo. plus mIgG versus Vis. plus mIgG. m, Top ten up-regulated GO terms. Data in k-m resulted from a single experiment (see also Extended Data Fig. 6); differentially expressed genes plotted in l were determined using a F-test with adjusted degrees of freedom based on weights calculated per gene with a zero-inflation model and Benjamini-Hochberg adjusted P-values; Gene Ontology analyses used over-representation test and scale bars in m represent Benjamini-Hochberg adjusted P-values for each pathway.
