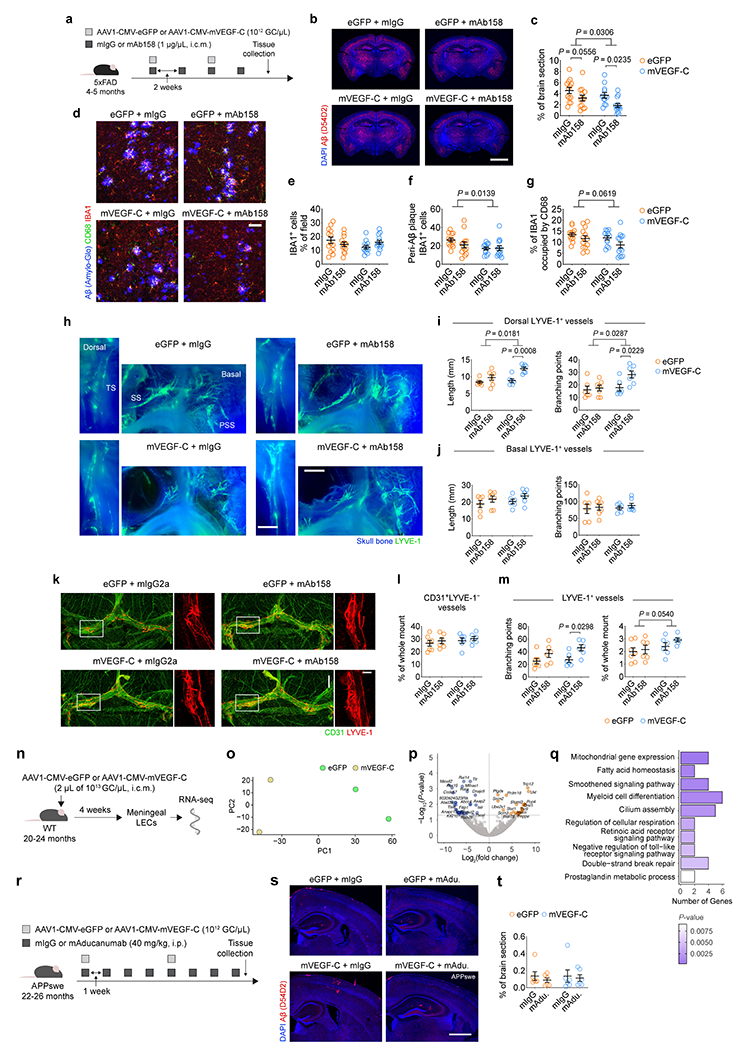
Extended Data Figure 7 |. Improved brain Aβ plaque clearance by delivery of mVEGF-C and mAb158 into the CSF is correlated with lymphatic vessel expansion at the dorsal meninges and transcriptional reprogramming of meningeal LECs.

a, Adult 4–5-month-old male 5xFAD mice were injected with 5 μL (i.c.m.) of AAV1 expressing enhanced green fluorescent protein (eGFP) or murine VEGF-C (mVEGF-C), under the cytomegalovirus (CMV) promoter (each at 1012 GC/μL), in combination with either mAb158 antibodies or the respective mIgG control (each at 1 μg/μL) antibodies. Antibody injections (5 μL at 1 μg/μL, i.c.m.) were repeated two weeks later. The same regimen of the aforementioned i.c.m. injections was repeated as indicated in the scheme and tissue was collected two weeks after the last injection. b, Representative images of brain sections stained for Aβ (red, stained with the D54D2 antibody) and with DAPI (blue; scale bar, 2 mm). c, Graph showing coverage of Aβ as percentage of brain section in each group. d, Representative images from the brain cortex stained for Aβ (blue, stained with the Amilo-Glo), CD68 (green) and IBA1 (red; scale bar, 50 μm). e-g, Graphs showing the e) coverage by IBA1+ cells (% of field), f) number of peri-Aβ plaque IBA1+ cells and g) percentage of IBA1 occupied by CD68 in each group. Results in c and e-g are presented as mean ± s.e.m.; n = 12 in mVEGF-C plus mIgG and n = 13 in eGFP plus mIgG, eGFP plus mAb158 and mVEGF-C plus mAb158; two-way ANOVA with Holm-Sidak’s multiple comparisons test; data in a-g result from 2 independent experiments. h, Representative fluorescence stereomicroscopy images of skull caps (skull bone signal in blue) and attached meningeal lymphatic vessels stained for LYVE-1 (in green) around the transverse sinus (TS) at the dorsal meninges or around the sigmoid (SS) and petrosquamosal (PSS) sinuses at the basal meninges (scale bars, 500 μm). i, j, Graphs showing LYVE-1+ vessels’ total length (in mm) and number of branching points in lymphatics at the i) dorsal and j) basal meninges. Results in h-j are presented as mean ± s.e.m.; n = 6 in mIgG groups and n = 7 in mAb158 groups; two-way ANOVA with Holm-Sidak’s multiple comparisons test; data in h-j are representative of 2 independent experiments. k, Representative images of meningeal whole mounts stained for CD31 (green) and LYVE-1 (red; scale bar, 1 mm; inset scale bar, 300 μm). l, m, Graphs showing the l) coverage by CD31+LYVE-1− vessels (% of meningeal whole mount) and the m) number of branching points and coverage by LYVE-1+ vessels (% of meningeal whole mount). Results in l and m are presented as mean ± s.e.m.; n = 7 in eGFP plus mIgG and n = 6 in eGFP plus mAb158, mVEGF-C plus mIgG and mVEGF-C plus mAb158; two-way ANOVA with Holm-Sidak’s multiple comparisons test; data in k-m are representative of 2 independent experiments. n, Aged WT mice (20–24 months of age) were injected with 2 μL (i.c.m.) of AAV1 expressing eGFP or mVEGF-C, under the CMV promoter (each at 1013 GC/μL). One month later, mice were transcardially perfused, skull caps were collected, meninges harvested and LECs were sorted by FACS for bulk RNA-seq. o, PCA plot showing segregation between eGFP (orange) and mVEGF-C (blue) meningeal LEC transcriptomes. p, Volcano plot showing the significantly down-regulated (in blue) and up-regulated (in orange) genes between meningeal LECs from the mVEGF-C and eGFP groups. q, Ten Gene Ontology terms (selected from the 30 most altered) obtained after analysis of the differentially expressed genes between meningeal LECs from the mVEGF-C and eGFP groups. Data in n-q consists of n = 2 per group; individual RNA samples result from LECs pooled from 10 meninges over 2 independent experiments; differentially expressed genes (P < 0.05) plotted in c were determined using a F-test with adjusted degrees of freedom based on weights calculated per gene with a zero-inflation model; Gene Ontology analysis in q used over-representation test and the scale bar represents the P-value for each pathway. r, Aged APPswe (22–26 months of age) were treated with viral vectors expressing eGFP or mVEGF-C (via i.c.m. injections) and with mIgG or mAdu. antibodies (via i.p. injections, according to the regimen in the scheme; related to Fig. 2). s, Representative images of brain sections stained for Aβ (red, stained with the D54D2 antibody) and with DAPI (blue; scale bar, 1 mm). t, Graph showing coverage of Aβ (as percentage of the brain sections) in each group. Results in t are presented as mean ± s.e.m.; n = 6 per group; two-way ANOVA with Holm-Sidak’s multiple comparisons test; data in r-t resulted from a single experiment.
