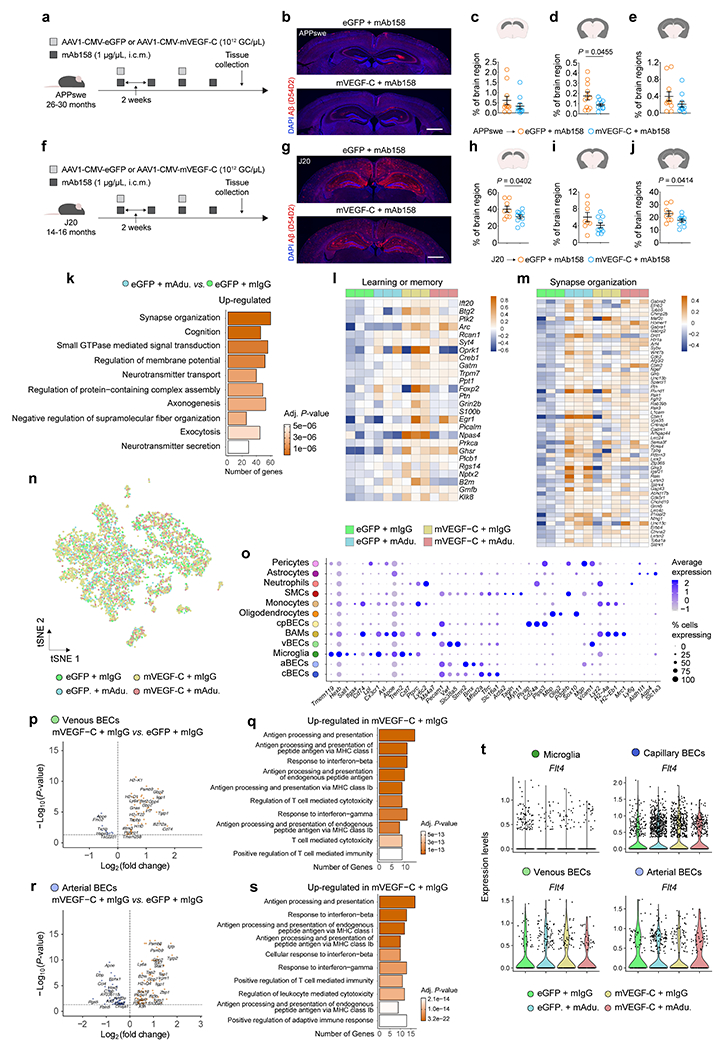
Extended Data Figure 8 |. Therapeutic effects of mVEGF-C on the clearance of Aβ by antibodies in old APPswe mice and the gene expression profile of brain cells.

a, Aged APPswe mice (26–30 months old) were injected with 5 μL (i.c.m.) of AAV1 expressing eGFP or mVEGF-C (each at 1012 GC/μL) in combination with mAb158 (at 1 μg/μL) as indicated in the scheme. b, Representative images of brain sections from APPswe mice stained for Aβ (red, stained with the D54D2 antibody) and with DAPI (blue; scale bar, 1 mm). c-e, Graphs showing coverage of Aβ (% of brain region) in the c) hippocampus, d) cortex/striatum/amygdala and e) combined regions. Results in c-e are presented as mean ± s.e.m.; n = 11 per group; two-tailed unpaired Student’s T test; data in a-e result from a single experiment. f, Aged J20 mice (14–16 months old) were injected with 5 μL (i.c.m.) of AAV1 expressing eGFP or mVEGF-C (each at 1012 GC/μL) in combination with mAb158 (at 1 μg/μL) as indicated in the scheme. g, Representative images of brain sections from J20 mice stained for Aβ (red, stained with the D54D2 antibody) and with DAPI (blue; scale bar, 1 mm). h-j, Graphs showing coverage of Aβ (% of brain region) in the h) hippocampus, i) cortex/striatum/amygdala and j) combined regions. Results in h-j are presented as mean ± s.e.m.; n = 8 in eGFP plus mAb158 and n = 10 in mVEGF-C plus mAb158; two-tailed unpaired Student’s T test; data in f-j result from a single experiment. k, Top ten Gene Ontology terms obtained after analyzing significantly up-regulated genes in hippocampi (n = 3 per group) from the eGFP plus mAdu. group when compared to the eGFP plus mIgG group (related to Fig. 2a–c). l, m, Heatmaps depicting the expression profile of genes comprised in the l) learning and memory (GO:0007611) and m) synapse organization (GO:0050808) Gene Ontology pathways (related to Fig. 2d, e). Data in k-m is from a single experiment; Gene Ontology analyses used over-representation test and scale bar in k represents Benjamini-Hochberg adjusted P-values; heatmaps in l and m depict counts-per-million normalized expression minus per-gene mean expression. n, Representation of the tSNE plot highlighting sequenced brain cells by group. o, Dot plot depicting the average scaled expression levels of specific genes (in the x axis) used to identify the brain cell populations, as well as the percentage of gene-expressing cells within each population; smooth muscle cells (SMCs) choroid plexus blood endothelial cells (cpBECs), border-associated macrophages (BAMs), venous BECs (vBECs), arterial BECs (aBECs) and capillary BECs (cBECs). p-s, Volcano plots, with significantly down-regulated (in blue) and up-regulated (in orange) genes, and Gene Ontology terms (obtained using up-regulated genes; selected from top 20 terms) obtained after comparing the transcriptomes of vBECs (p and q) and aBECs (r and s) from the mVEGF-C plus mIgG group and the eGFP plus mIgG group. t, Violin plots showing the expression levels of the Flt4 gene in microglia, capillary, venous and arterial BECs in each group. Data in n-t are related to Fig. 2f–k and resulted from a single experiment where the transcriptomes of 7,739 cells (isolated from brain hemispheres of 3 mice per group) were analyzed, including 2,345 microglia, 2,934 cBECs, 602 vBECs and 766 aBECs; differentially expressed genes plotted in p and r were determined using an F-test with adjusted degrees of freedom based on weights calculated per gene with a zero-inflation model and Benjamini-Hochberg adjusted P-values; Gene Ontology analyses used over-representation test and scale bars in q and s represent Benjamini-Hochberg adjusted P-values for each pathway; gene expression comparison in t was done using Wilcoxon Rank-Sum test with Bonferroni’s P-value adjustment.
