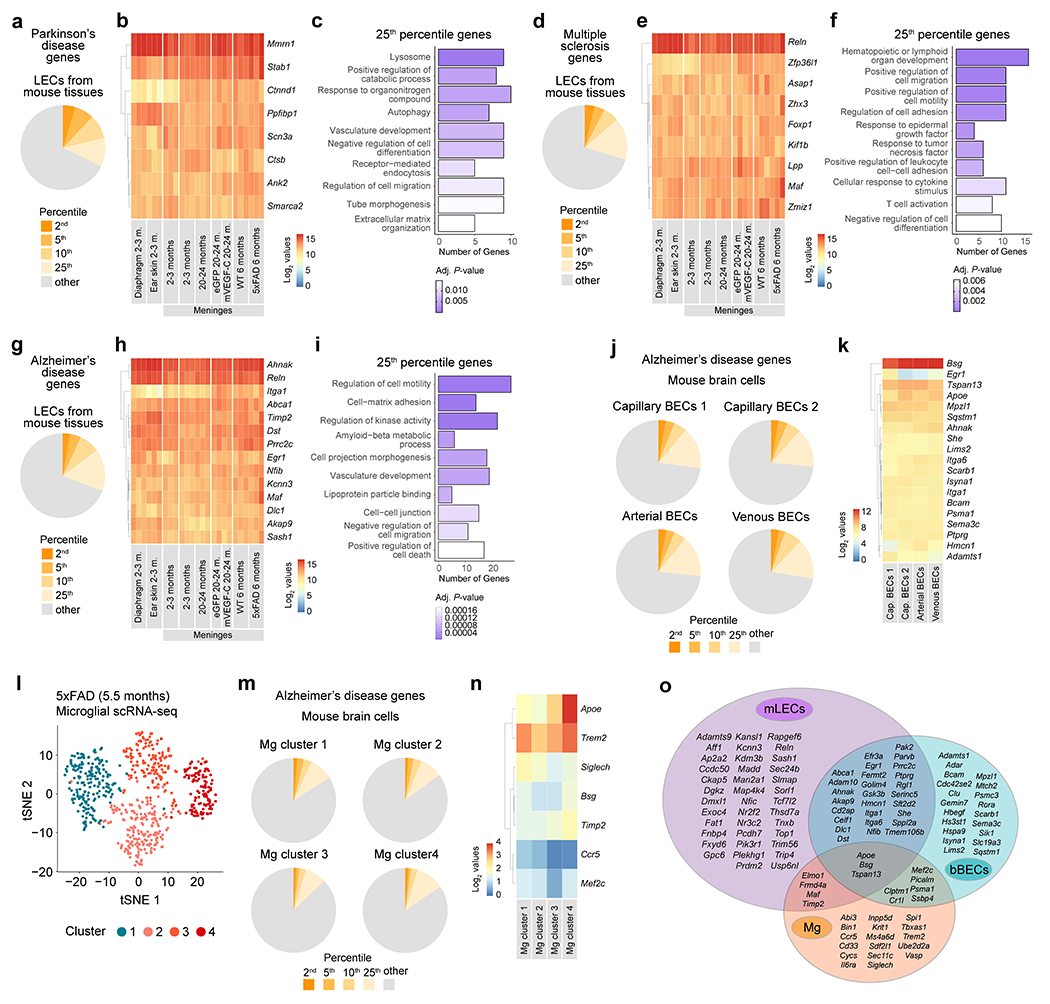
Extended Data Figure 9 |. Expression profile of genes associated with Parkinson’s disease, multiple sclerosis and AD in meningeal LECs, brain blood endothelial cells and microglia from different mouse models.

a, Pie chart showing the proportion of Parkison’s disease-associated genes, for which the average expression across all RNA-seq datasets of lymphatic endothelial cells (LECs) was in the top 2nd, 5th, 10th, or 25th percentile out of all genes. b, Heatmap showing the log2-normalized expression values (depicted in the color scale bar) for Parkinson’s disease-associated genes whose average expression values fall within the top 2nd percentile of all genes expressed across all LECs’ RNA-seq datasets. c, Gene-sets obtained by functional enrichment of 25th percentile Parkinson’s disease-associated genes expressed across all LECs’ RNA-seq datasets. d, Pie chart showing the proportion of multiple sclerosis-associated genes, for which the average expression across all LECs’ RNA-seq datasets was in the top 2nd, 5th, 10th, or 25th percentile out of all genes. e, Heatmap showing the log2-normalized expression values (depicted in the color scale bar) for multiple sclerosis-associated genes whose average expression values fall within the top 2nd percentile of all genes expressed across all LECs’ RNA-seq datasets. f, Gene-sets obtained by functional enrichment of 25th percentile multiple sclerosis-associated genes expressed across all LECs’ RNA-seq datasets. g, Pie chart showing the proportion of AD-associated genes, for which the average expression across all LECs’ RNA-seq datasets was in the top 2nd, 5th, 10th, or 25th percentile out of all genes. h, Heatmap showing the log2-normalized expression values (depicted in the color scale bar) for AD-associated genes whose average expression values fall within the top 2nd percentile of all genes expressed across all LECs’ RNA-seq datasets. i, Gene-sets obtained by functional enrichment of 25th percentile AD-associated genes expressed across the different LECs’ RNA-seq datasets. Data in a-i consists of n = 2 or 3 per group; individual RNA samples result from LECs pooled from 10 mice; genes used in a-i resulted from RNA-seq datasets obtained from LECs isolated from diaphragm, ear skin and meninges at 2–3 months (m.), from meninges at 2–3 or 20–24 months, from meninges at 20–24 months after injections with AAV1-CMV-eGFP (eGFP) or AAV1-CMV-mVEGF-C-WPRE (mVEGF-C, one month after i.c.m. injection − see methods for details) and from meninges of 6-month-old WT or 5xFAD mice (see Extended Data Fig. 1f–k for related data); in c, f and i the Benjamini-Hochberg correction was used to adjust the associated P-values (adj. P-values < 0.05) and the functional enrichment of differential expressed genes was determined with Fisher’s exact test. j, Pie charts showing the proportion of AD-associated genes, for which the average expression was in the top 2nd, 5th, 10th, or 25th percentile out of all genes in each cluster of brain blood endothelial cells (BECs): capillary BECs 1, capillary BECs 2, arterial BECs and venous BECs. k, Heatmap showing the expression values for AD-associated genes whose average expression values fall within the top 2nd percentile of all genes expressed in each cluster of BECs. l, The transcriptome of myeloid cells (live CD45+Ly6G−CD11b+ cells) sorted from the brain cortex of 5.5-month-old 5xFAD mice was analyzed by single-cell RNA-seq (scRNA-seq, see methods for more details). The graph shows the unsupervised clustering and tSNE representation of four distinct clusters of microglia (Mg). m, Pie charts showing the proportion of AD-associated genes, for which the average expression was in the top 2nd, 5th, 10th, or 25th percentile out of all genes in each Mg cluster. n, Heatmap showing the expression values for AD-associated genes whose average expression values fall within the top 2nd percentile of all genes expressed in each Mg cluster. o, Venn diagram showing the overlap between AD-associated genes in the top 10th percentile for meningeal LECs (mLECs), brain BECs (bBECs) and Mg. Data in j and k resulted from the analysis of a scRNA-seq dataset published by Vanlandewijck et al; data in l-n resulted from the scRNA-seq analysis of 651 microglia; in k and n, scale bars represent log2-normalized expression values.
