
Extended Data Figure 1 |. Morphological assessment and functional enrichment analysis of differentially expressed genes show accelerated meningeal lymphatic dysfunction in 5xFAD mice.
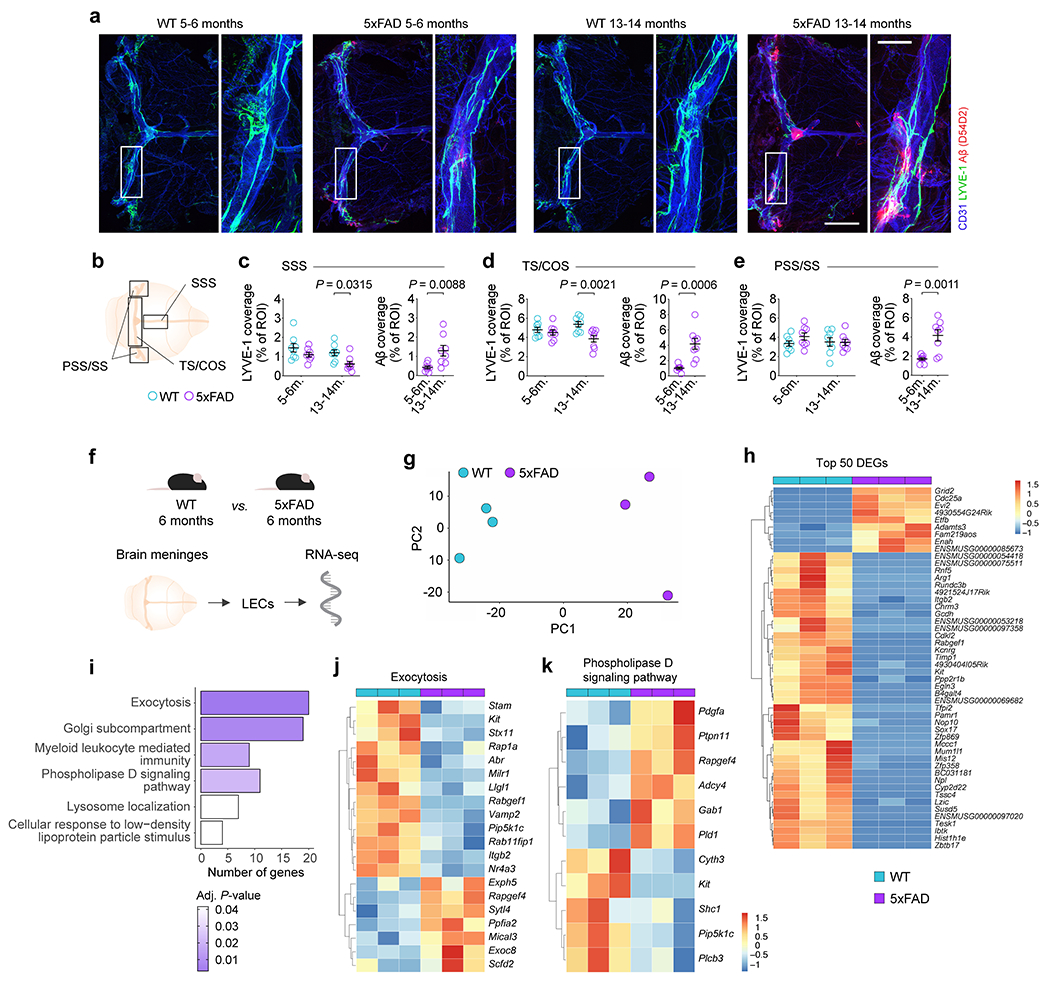
a, Representative images of meningeal whole mounts from 5xFAD mice at 5–6 and 13–14 months of age, stained for CD31 (blue), LYVE-1 (green) and Aβ (red, stained with the D54D2 antibody; scale bar, 2 mm; inset scale bar, 500 μm). b, Scheme depicting the compartmentalization of the meningeal whole mount for quantification of LYVE-1 and Aβ coverage. c-e, Graphs showing the coverage by LYVE-1+ vessels and Aβ as a percentage of the region of interest (% of ROI) at the c) superior sagittal sinus (SSS), d) transverse sinus and confluence of sinuses (TS/COS), and e) petrosquamosal and sigmoid sinuses (PSS/SS). Results in a-e are presented as mean ± s.e.m.; n = 8 per group; two-way ANOVA with Holm-Sidak’s multiple comparisons test (for LYVE-1+ vessels) and two-tailed unpaired Student’s T test (for Aβ coverage); data result from 2 independent experiments. f, Lymphatic endothelial cells (LECs) were isolated from the brain meninges of male 5xFAD mice and WT littermate controls at 6 months of age, total RNA was extracted and sequenced. g, Principal component analysis (PCA) plot showing segregation between WT (blue) and 5xFAD (purple) meningeal LEC transcriptomes. h, Heatmap of top 50 differentially expressed genes in 5xFAD meningeal LECs at 6 months of age. i, Gene-sets obtained by functional enrichment of differentially expressed genes in meningeal LECs from 5xFAD mice. j, k, Exocytosis (GO:0006887) and phospholipase D signaling pathway (KEGG:mmu04072) gene-sets obtained by functional enrichment analysis, with corresponding differentially expressed genes. Data in f-k consists of n = 3 per group; individual RNA samples result from LECs pooled from 10 meninges over 3 independent experiments; the Benjamini-Hochberg correction was used to adjust the associated P-values in i (adj. P-value < 0.05); functional enrichment of differential expressed genes in i was determined with Fisher’s exact test; color scale bar in h and k represents expression values for each sample as standard deviations from the mean across each gene.