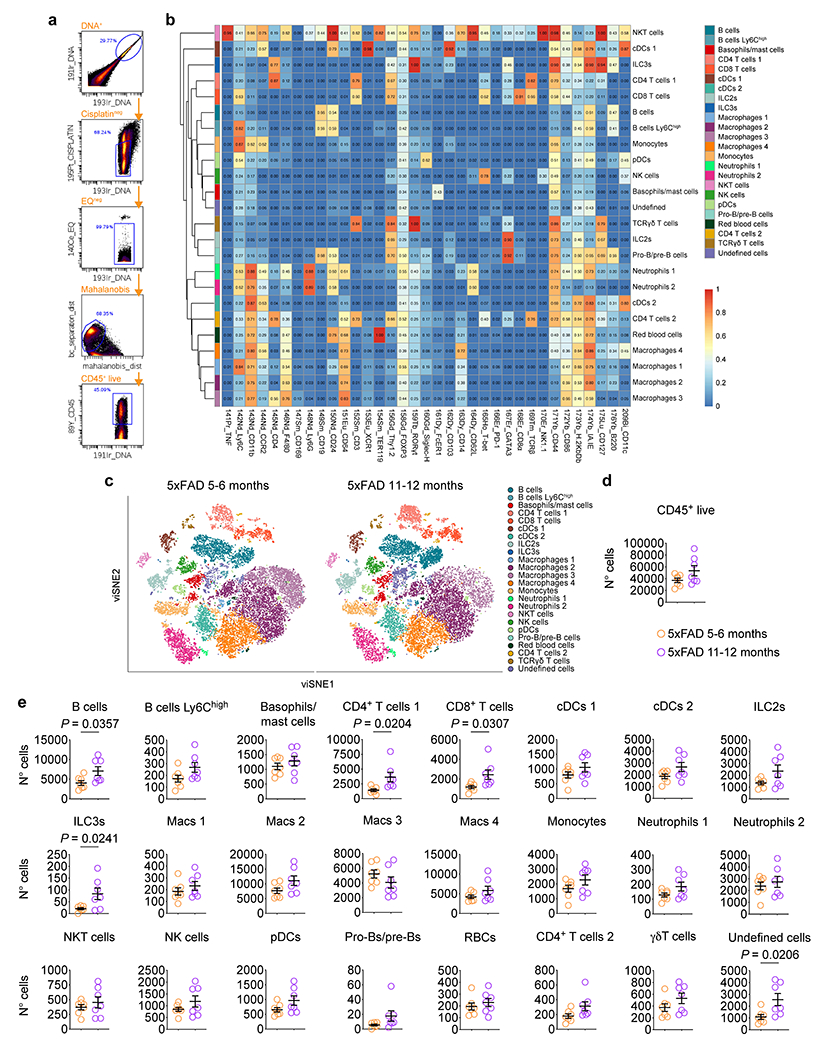
Extended Data Figure 2 |. Meningeal immune cell profiling by mass cytometry in 5xFAD mice at 5–6 and 11–12 months.

a, Meningeal single-cell suspensions were obtained from male 5xFAD mice at 5–6 months and 11–12 months and processed for mass cytometry. Representative mass cytometry dot plots depicting gating strategy used to select CD45+ live cells used in further high-dimensional analysis. b, Heatmaps of the median marker expression values for each immune cell cluster identified using Rphenograph. Median marker expression values are indicated by color intensity depicted in the scale bar. c, t-distributed stochastic neighbor embedding-based visualization (viSNE) plots showing unsupervised clustering of CD45+ live immune cells. d, Number of CD45+ live meningeal leukocytes at 5–6 (orange) and 11–12 (purple) months in 5xFAD mice. e, Numbers of different meningeal immune cells showing a statistically significant increase in B cells, CD4+ T cells 1, CD8+ T cells, type 3 innate lymphoid cells (ILC3s) and undefined cells in the meninges of 5xFAD mice at 11-12 months of age. Data in a-e are representative of a single experiment; results in d and e are presented as mean ± s.e.m.; n = 7 per group; two-tailed unpaired Student’s T test.
