
Extended Data Figure 5 |. Meningeal lymphatic vessel ablation precludes brain Aβ plaque clearance by mAb158 administered into the CSF.
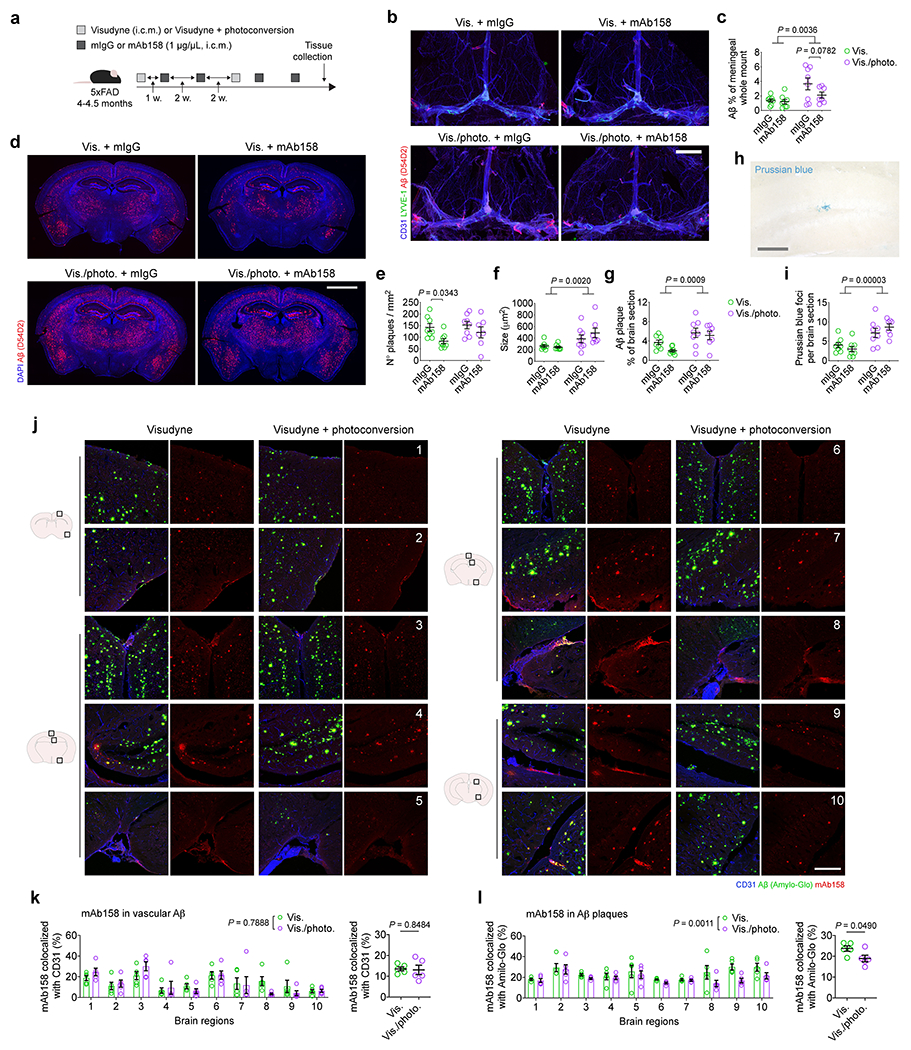
a, Adult 4–4.5-month-old male 5xFAD mice were injected (i.c.m.) with Visudyne (5 μL) plus photoconversion (Vis./photo.) or Visudyne without photoconversion (Vis.). One week later, 5 μL of mAb158 antibodies or the same volume of the control murine IgG (mIgG) antibodies were directly injected into the CSF (i.c.m.), both at 1 μg/μL. Injections with antibodies were repeated two weeks later. Additional steps of meningeal lymphatic vessel ablation or control interventions were followed by two more i.c.m. injections with antibodies according to the scheme. b, Representative images of meningeal whole mounts stained for CD31 (blue), LYVE-1 (green) and Aβ (red, stained with the D54D2 antibody; scale bar, 2 mm). c, Graph showing the coverage by Aβ as a percentage of the meningeal whole mount. d, Representative images of brain sections from 5xFAD mice stained for Aβ (red, stained with the D54D2 antibody) and with DAPI (blue; scale bar, 2 mm). e-g, Graphs showing e) number of Aβ plaques per mm2 of brain section, f) average size of Aβ plaques (μm2) and g) total coverage of Aβ plaques (% of brain section) in each group. h, Representative inset showing an example of a Prussian blue focus in a brain tissue section of a 5xFAD mouse (scale bar, 100 μm). i, Graph showing the quantifications of Prussian blue foci per brain section in each group. Data in a-i are representative of 2 independent experiments; results in c, e-g and i are presented as mean ± s.e.m.; n = 8 in Vis. plus mIgG, Vis. plus mAb158 and Vis./photo. plus mIgG, n = 7 in Vis./photo. plus mAb158; two-way ANOVA with Holm-Sidak’s multiple comparisons test. j, 5xFAD mice (5 months old) with intact or ablated meningeal lymphatic vasculature were injected (i.c.m.) with 5 μL of mAb158 (at 1 μg/μL). One hour later, mice were transcardially perfused and the brains were collected for assessment of mAb158 linked to Aβ in blood vasculature or Aβ plaques. Images of ten different regions of the brain of 5xFAD mice from each group showing blood vessels stained for CD31 (blue), Aβ plaques (green, stained with Amylo-Glo) and mAb158 (red; scale bar, 200 μm). k, Graphs with colocalization between mAb158 and CD31 (% of total CD31 coverage) in each brain region (1 to 10) or presented as the average of all regions. l, Graphs with colocalization between mAb158 and Amilo-Glo (% of total Amilo-Glo-stained Aβ plaques) in each brain region (1 to 10) or presented as the average of all regions. Data in j-l result from a single experiment; results in k and l are presented as mean ± s.e.m.; n = 5 per group; two-way ANOVA with Holm-Sidak’s multiple comparisons test (for comparisons between groups in each brain region) and two-tailed unpaired Student’s T test (for comparisons between the two groups).