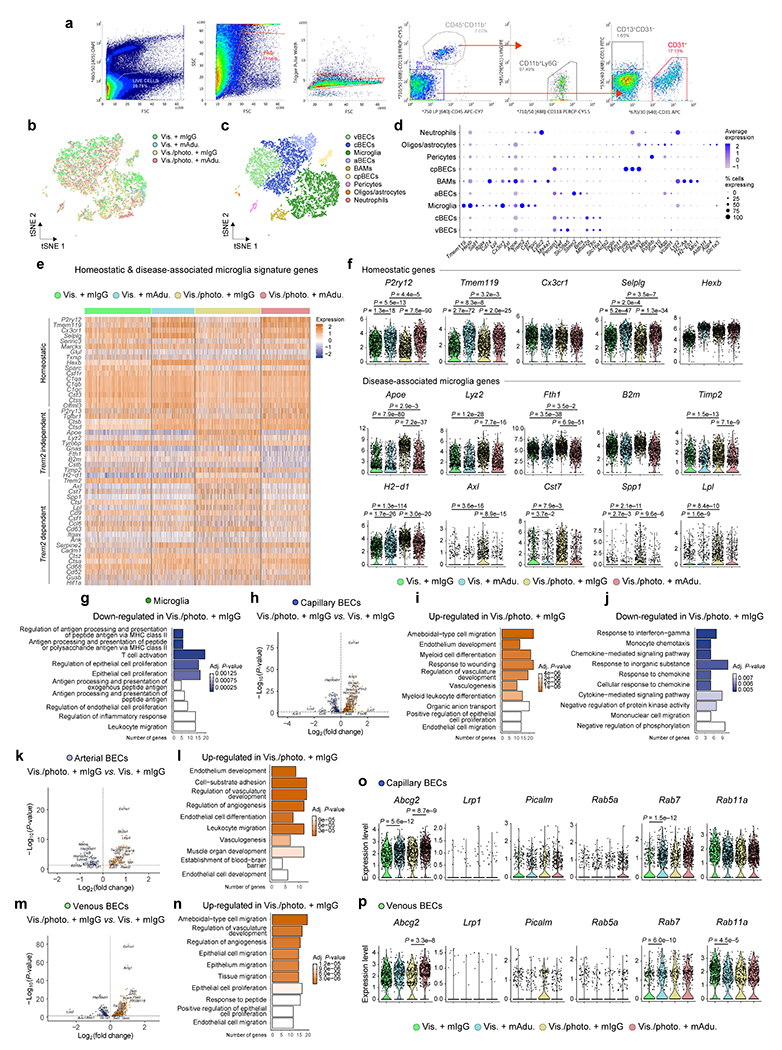
Extended Data Figure 6 |. Effects of meningeal lymphatic vessel ablation and mAducanumab immunotherapy on the microglial and blood endothelial cell transcriptomes in 5xFAD mice.

a, Representative flow cytometry dot plots showing gating strategy used to sort (and enrich for) live (DAPI−) singlets that were CD45+CD11b+Ly6G− (macrophages/microglia), CD45−CD11b−CD31+ (blood endothelial cells) and CD45−CD11b−CD13+CD31− (mural cells). b, c, Representations of the t-distributed stochastic neighbor embedding (tSNE) plots highlighting the brain cells identified by single-cell RNA-seq discriminated by b) group or c) type. d, Dot plot depicting the average scaled expression levels of specific genes (in the x axis) used to identify the brain cell populations, as well as the percentage of cells expressing those genes within each population; choroid plexus blood endothelial cells (cpBECs), border-associated macrophages (BAMs), arterial BECs (aBECs), capillary BECs (cBECs), venous BECs (vBECs). e, Heatmap showing expression levels of genes involved in the transition from homeostatic to Trem2-independent and Trem2-dependent disease-associated microglia phenotypes in the different groups. f, Violin plots showing the expression levels of the homeostatic P2ry12, Tmem119, Cx3cr1, Selplg and Hexb genes, and disease-associated microglia Apoe, Lyz2, Fth1, B2m, Timp2, H2-d1, Axl, Cst7, Spp1 and Lpl genes in each group. g, Top ten Gene Ontology terms obtained after analyzing significantly down-regulated genes in microglia from the Vis./photo. plus mIgG group, when compared to the Vis. plus mIgG group. h, Volcano plot with significantly down-regulated (in blue) and up-regulated (in orange) genes after comparing the transcriptomes of cBECs from the Vis./photo. plus mIgG and the Vis. plus mIgG groups. i, j, Top ten Gene Ontology terms obtained after analyzing significantly i) up-regulated or j) down-regulated genes in cBECs from the Vis./photo. plus mIgG group, when compared to the Vis. plus mIgG group. k-n, Volcano plots, with significantly down-regulated (in blue) and up-regulated (in orange) genes, and top ten Gene Ontology terms (using up-regulated genes) obtained after comparing the transcriptomes of aBECs (k and l) and vBECs (m and n) from the Vis./photo. plus mIgG and the Vis. plus mIgG groups. o, p, Violin plots showing the expression levels of Abcg2, Lrp1, Picalm, Rab5a, Rab7 and Rab11a in o) cBECs and p) vBECs from each group. Data in a-p resulted from a single experiment where the transcriptomes of 7,286 cells (isolated from brain hemispheres of 3 mice per group) were analyzed, including 2,625 microglia, 1,958 cBECs, 545 aBECs and 1,412 vBECs; scale bar in e represents scaled expression at the single-cell level; differentially expressed genes plotted in h, k and m were determined using a F-test with adjusted degrees of freedom based on weights calculated per gene with a zero-inflation model and Benjamini-Hochberg adjusted P-values; Gene Ontology analyses used over-representation test and scale bars in g, i, j, l and n represent Benjamini-Hochberg adjusted P-values for each pathway; gene expression comparison in f, o and p was done using Wilcoxon Rank-Sum test with Bonferroni’s adjusted P-values reported.
