. 2022 Jan 10;31(4):901–909. doi: 10.1055/s-0041-1741103
Indian Radiological Association. This is an open access article published by Thieme under the terms of the Creative Commons Attribution-NonDerivative-NonCommercial License, permitting copying and reproduction so long as the original work is given appropriate credit. Contents may not be used for commercial purposes, or adapted, remixed, transformed or built upon. (
https://creativecommons.org/licenses/by-nc-nd/4.0/
)
This is an open-access article distributed under the terms of the Creative Commons Attribution-NonCommercial-NoDerivatives License, which permits unrestricted reproduction and distribution, for non-commercial purposes only; and use and reproduction, but not distribution, of adapted material for non-commercial purposes only, provided the original work is properly cited.
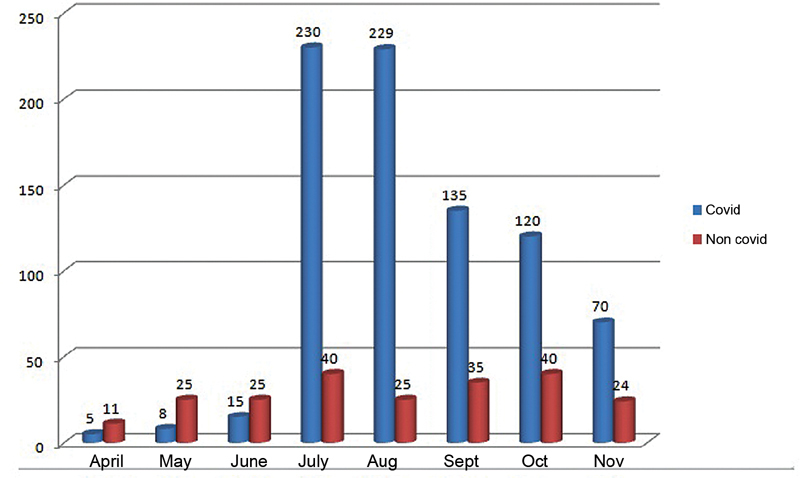
Fig. 10.

Bar chart showing the monthly distribution pattern of coronavirus disease-2019 (COVID-19) and non-COVID-19 infections.
