
Figure 2.
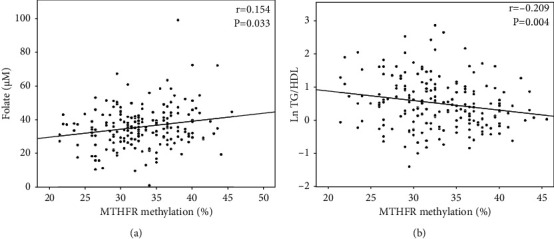
MTHFR methylation was positively correlated with (a) folate circulating levels while it was negatively correlated with the (b) TG/HDL ratio. Spearman's Rho and p values are shown. Ln: logarithmic function.
Official websites use .gov
A
.gov website belongs to an official
government organization in the United States.
Secure .gov websites use HTTPS
A lock (
) or https:// means you've safely
connected to the .gov website. Share sensitive
information only on official, secure websites.
MTHFR methylation was positively correlated with (a) folate circulating levels while it was negatively correlated with the (b) TG/HDL ratio. Spearman's Rho and p values are shown. Ln: logarithmic function.