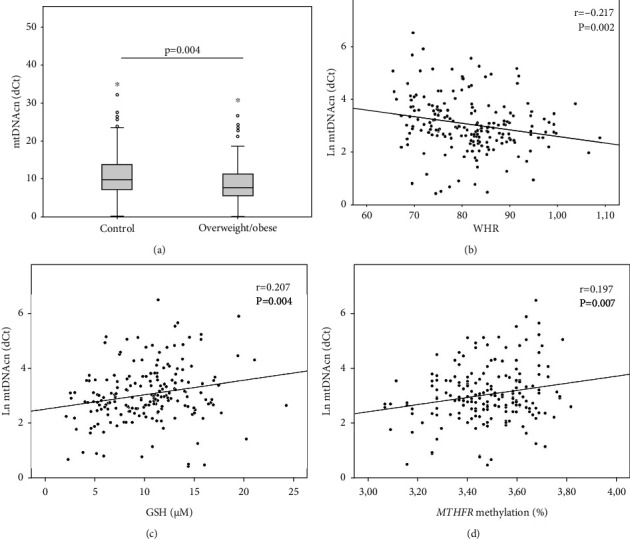
Figure 3.

mtDNAcn and body composition. mtDNAcn is lower in (a) overweight/obese than in controls, and it is inversely correlated with (b) WHR. mtDNAcn positively correlates with (c) GSH levels and (d) MTHFR methylation. Pearson's correlation and p values are shown as well. Ln: logarithmic function.
