
Figure 4.
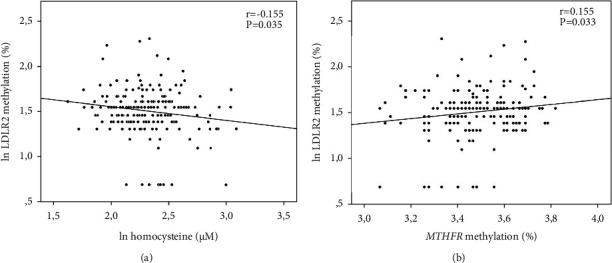
LDLR2 methylation correlations with (a) homocysteine levels and (b) MTHFR methylation levels. Pearson's correlations and p values are shown. Ln: logarithmic function.
Official websites use .gov
A
.gov website belongs to an official
government organization in the United States.
Secure .gov websites use HTTPS
A lock (
) or https:// means you've safely
connected to the .gov website. Share sensitive
information only on official, secure websites.
LDLR2 methylation correlations with (a) homocysteine levels and (b) MTHFR methylation levels. Pearson's correlations and p values are shown. Ln: logarithmic function.