Figure 6.

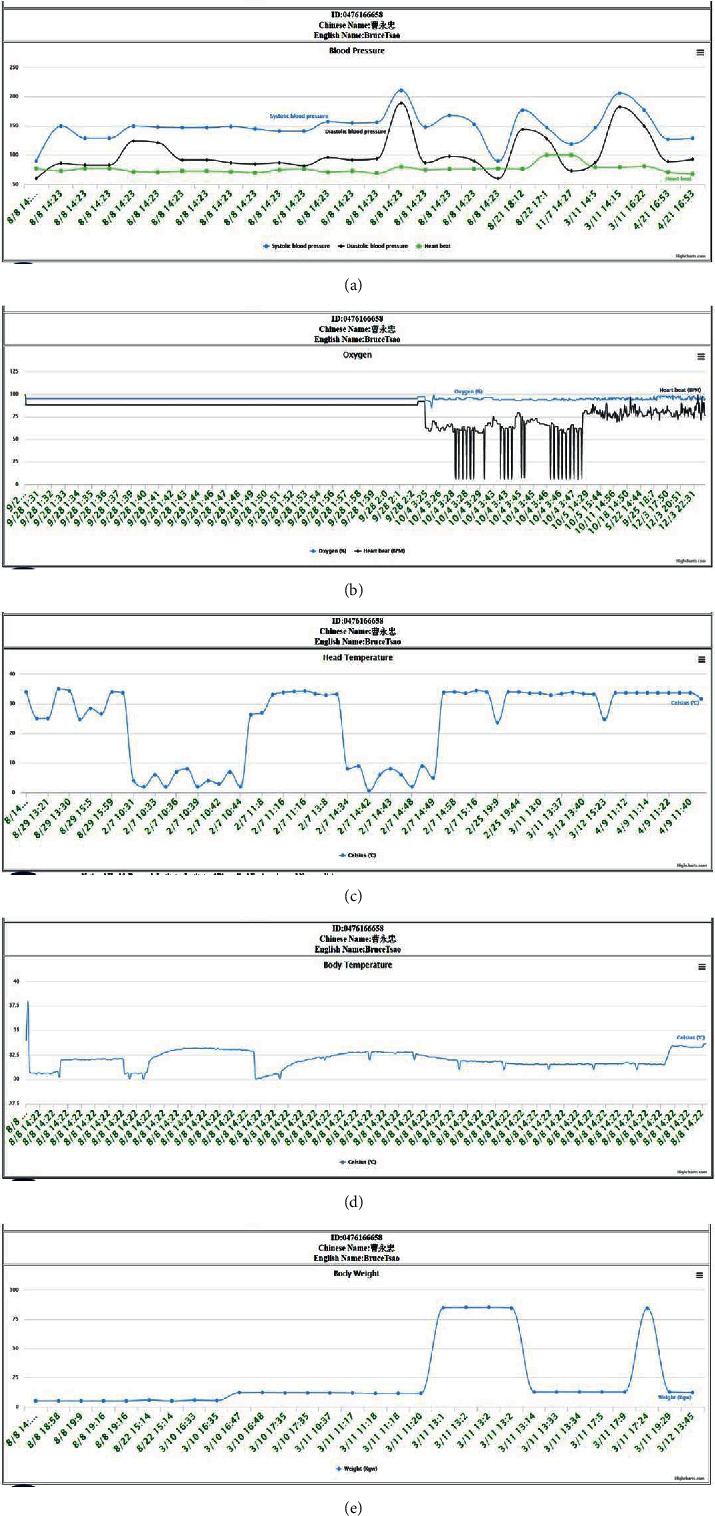
Detailed data displayed after clicking on the icon are shown in Figure 5 and presented as charts. These detailed charts are generated from the cloud platform provided by the SHMS. (a) shows the blood pressure results, including the blood pressure itself (systolic blood pressure and diastolic blood pressure) and the heart rate (maximum of 120 records), produced by our blood pressure device. Clients can learn the circulation status of the whole body, whether their blood pressure status is good or poor, and when hypertension occurs. (b) shows the blood oxygen results, including the blood oxygen level and heart rate (maximum of 120 records), obtained with the blood oxygen device. These results help clients understand the final blood circulation status and the circulation status of the whole body, which indicates whether their blood circulation is good or poor. (c) shows the head temperature results from thermal temperature scans (maximum of 120 records), which can be employed to detect and record body temperature in a contactless way. (d) shows the body temperature results from the elbow (maximum of 120 records) produced by our body temperature device. This device can continue to detect and record body temperature at intervals of a few seconds; thus, it can be applied in unhealthy conditions and can provide data that can be displayed in a long-term continuous temperature chart for the same interval. (e) shows the user weight results (maximum of 120 records) produced by our body weight device, and clients can determine whether they need to improve their health based on, e.g., their BMI. The measured body weight can also indicate blood pressure changes when the body weight changes over a long duration.
