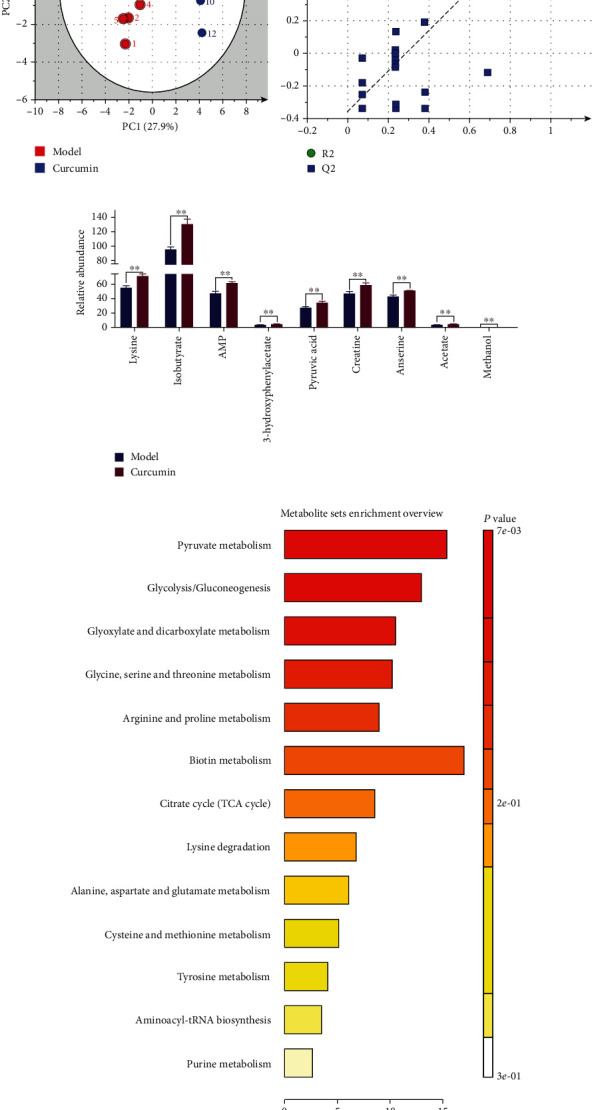
Figure 6.

Metabolomics analysis of gastrocnemius tissue in tumor-bearing mice after curcumin intervention. (a) PLS-DA scatter plot of gastrocnemius samples in the model group and the curcumin group (n = 8/group). (b) Validation plot of gastrocnemius samples obtained from the model and curcumin groups (n = 8/group). (c) Gastrocnemius differential metabolites filtered by the conditions of VIP > 1 and p < 0.05. (d) Pathway analysis of differential metabolites; ∗∗p < 0.01 by t-test, compared to the model group. Data were shown as mean ± standard errors of the mean.
