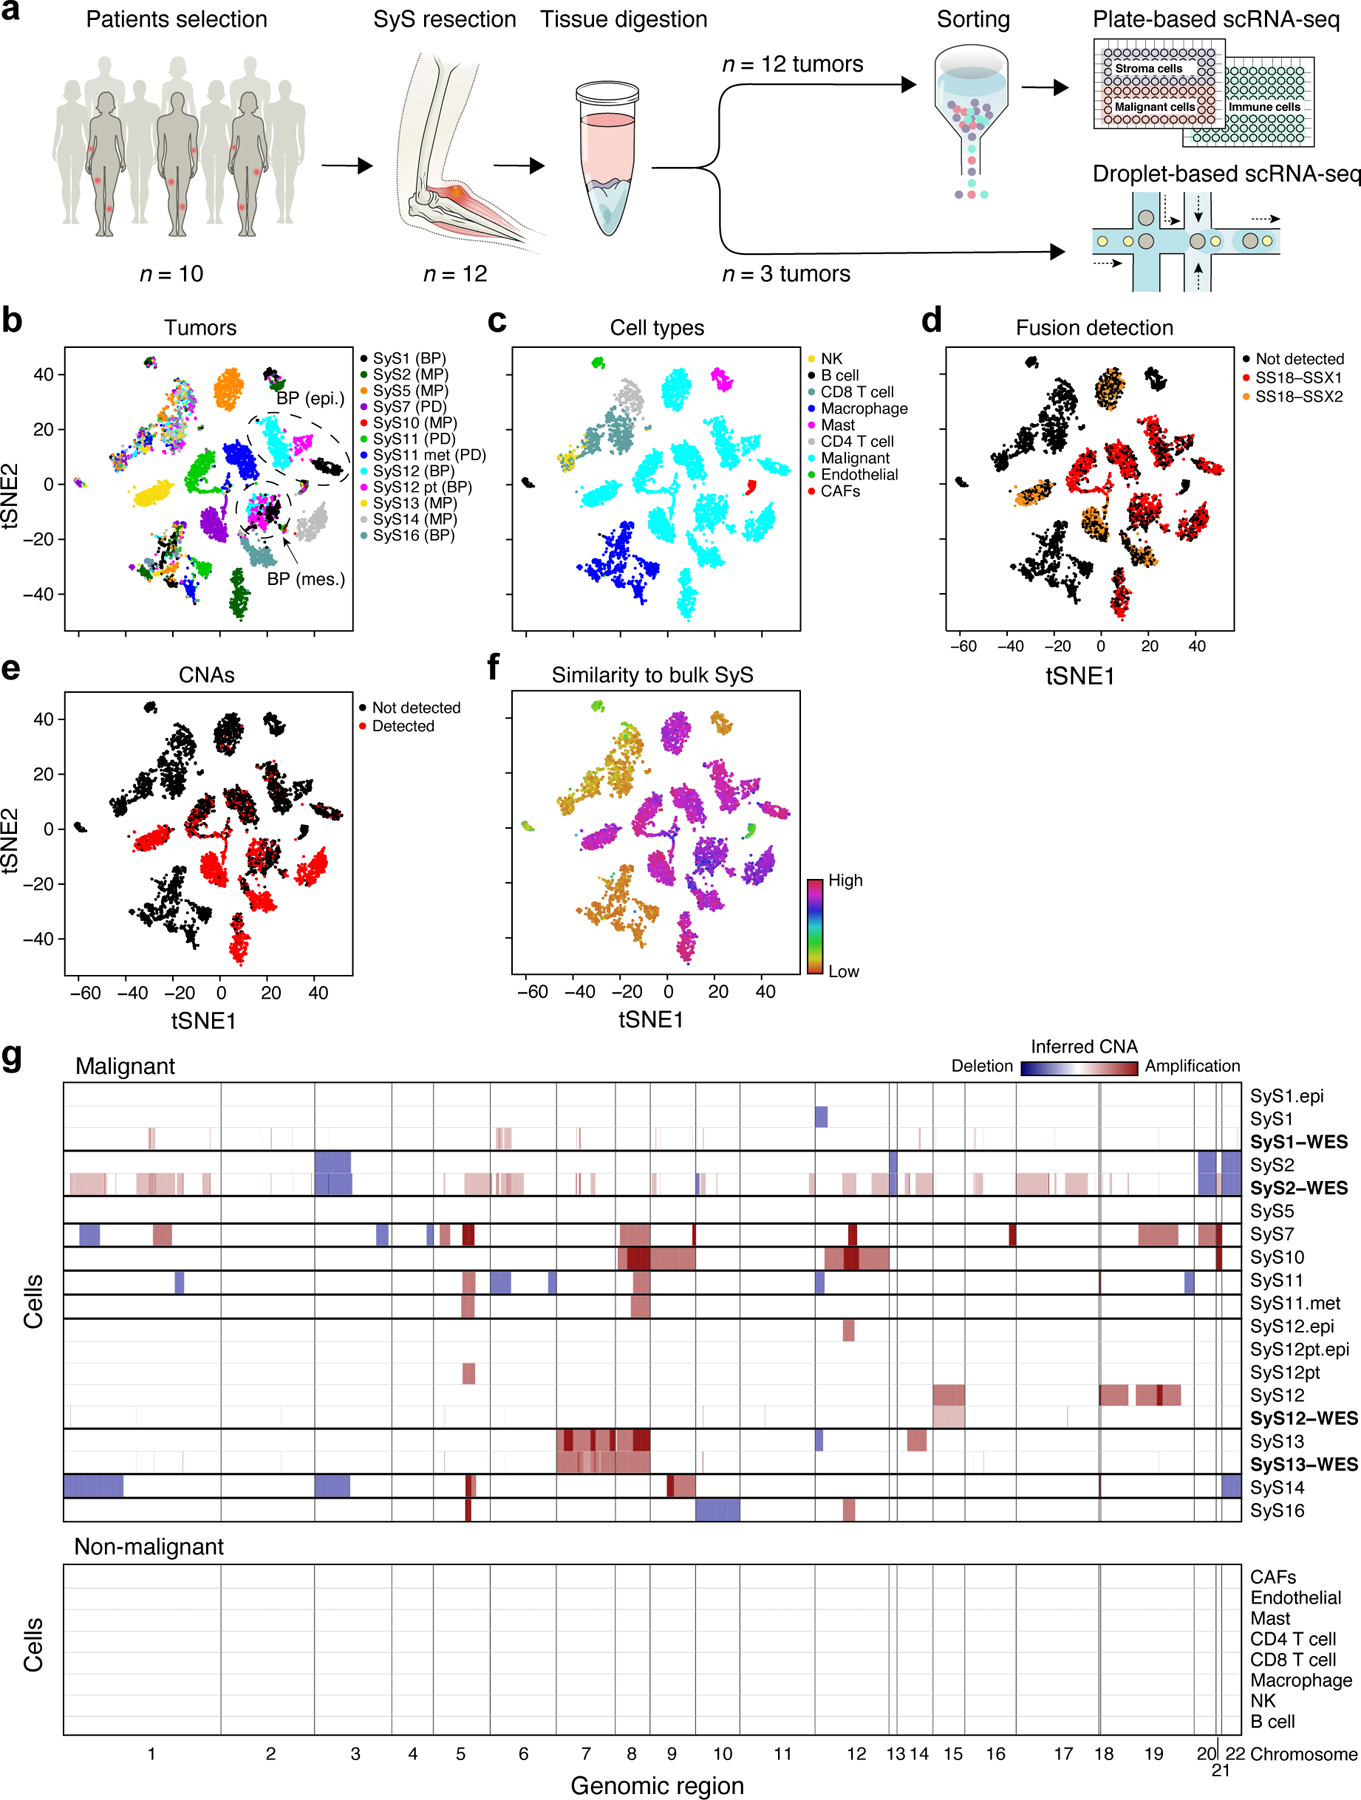
Fig. 1. Single-cell map of the cellular ecosystem of synovial sarcoma tumors.

(a) Study workflow. (b-e) Consistent assignment of cell identity. t-SNE plots of scRNA-Seq profiles (dots), colored by either (b) tumor sample, (c) inferred cell type, (d) SS18-SSX1/2 fusion detection, (e) CNA detection, and (f) differential similarity to SyS compared to other sarcomas (Online Methods). Dashed ovals (b): mesenchymal and epithelial malignant subpopulations of biphasic (BP) tumors. (g) Inferred large-scale CNAs distinguish malignant (top) from non-malignant (bottom) cells, and are concordant with WES data (bold). The CNAs (red: amplifications, blue: deletions) are shown along the chromosomes (x axis) for each cell (y axis).
