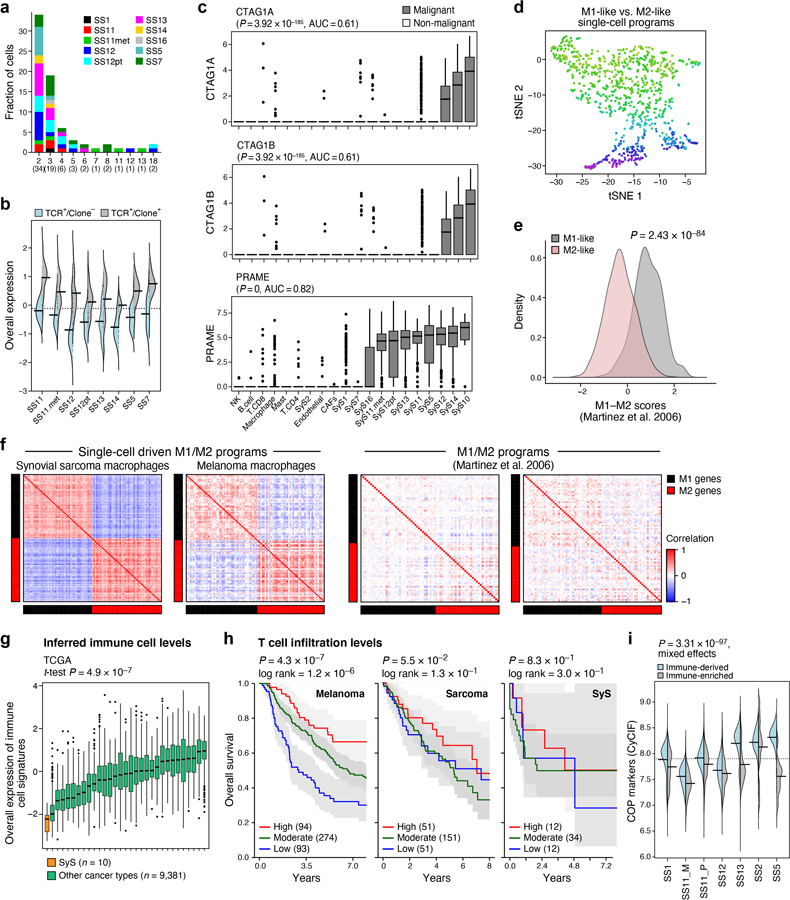
Extended Data Fig. 4. Antitumor immunity and immune evasion in SyS.

(a) CD8 T cell clones, stratified based on clone size (x axis) and tumor (color). (b) Overall expression of the T cell expansion program in CD8 T cells with a reconstructed TCR (TCR+), when stratified based on clonality (Clone+ and Clone−, denoting clone size greater or equal to 1, respectively). (c) The cancer testis antigens CTAG1A, CTAG1B (encoding for NY-ESO-1), and PRAME are exclusively expressed by SyS malignant (n = 4,371) cells compared to non-malignant ones (n = 2,375). Log-transformed TPM (y axis) in different cell subsets (x axis); p-values: one-sided Mann-Whitney test. (d) tSNE of macrophage profiles, colored by M1/M2 polarization scores, according to signatures defined here (Supplementary Table 4). (e) M1/M2 polarization scores (y axis) according to previously defined signatures42 in macrophages in our datasets partitioned to M1-like and M2-like subgroups (p-value: two-sided t-test). (f) Spearman correlation coefficient (color bar) between each pair of genes from M1 and M2 signatures defined here (top, Supplementary Table 4) or previously42 (bottom) across macrophages in SyS (left) and melanoma30 (right). (g) Overall Expression of the immune cell signatures (y axis, Online Methods) in SyS tumors (orange) and other cancer types (green); p-value: one-sided t-test. (c) and (g) middle line: median; box edges: 25th and 75th percentiles, whiskers: most extreme points that do not exceed ±IQR*1.5; further outliers are marked individually. (h) Prognostic value of T cell levels in different tumor types. Kaplan-Meier (KM) curves of survival in melanoma (left; TCGA), sarcoma (middle)21, and SyS (8) (right), stratified by high (top 25%, red), low (bottom 25%, blue), or intermediate (remainder, green) levels of inferred T cell infiltration levels; P: COX regression. (i) Protein expression (CyCIF) of core oncogenic program markers in immune-enriched and deprived niches.
