
Extended Data Fig. 5. Characterizing the transcriptional impact of SS18-SSX inhibition and tumor microenvironment cytokines on synovial sarcoma cells.
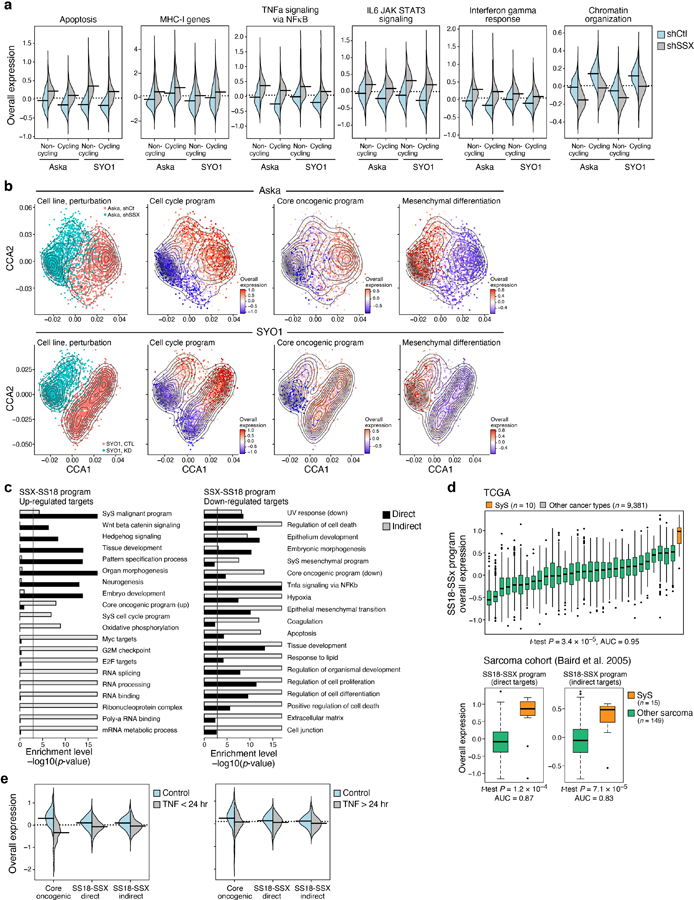
(a) The fusion KD induces innate immune programs. Distribution of Overall Expression scores (y axis) in the pathways most differentially expressed between SyS cells with SS18-SSX (shSSX, grey) vs. control (shCt, blue) shRNA, shown separately for non-cycling and cycling cells (x axis). (b) Co-embedding (using PCA and canonical correlation analyses80, Online Methods) of Aska (top) and SYO1 (bottom) cell profiles (dots), colored by: (1) perturbation; or the Overall Expression (colorbar) of the (2) cell cycle, (3) core oncogenic, or (4) mesenchymal differentiation31,32 programs. (c) Biological processes regulated in the SS18-SSX program. Gene sets (rows) most enriched (-log10(P-value), hypergeometric test, x axis) in induced (left) and repressed (right) SS18-SSX program genes, which are either direct (black bars) or indirect (grey bars) targets of SS18-SSX based on ChIP-Seq data16,17 and genetic perturbation. Vertical line denotes statistical significance following multiple hypotheses correction. (d) The SS18-SSX program distinguishes SyS from other cancer types and other sarcomas. Overall Expression of the SS18-SSX program (y axis) in either TCGA samples (n = 9,391, top), stratified by cancer types (x axis), or in another independent cohort of sarcoma tumors (n = 164, bottom) (48). Middle line: median; box edges: 25th and 75th percentiles, whiskers: most extreme points that do not exceed ±IQR*1.5; further outliers are marked individually. **P<0.01, ***P<1*10−3, ****P<1*10−4, one-sided t-test. (e) Repression of the core oncogenic and SS18-SSX programs by short term TNF treatment is not sustained long term. Distribution of Overall Expression scores (y axis) of the core oncogenic program and the direct and indirect SS18-SSX programs (x axis) in control cells (blue) and cells treated with TNF for 4–6 hours (left) or more than 24 hours (right).