
Fig. 2. Cellular plasticity and a core oncogenic program characterize synovial sarcoma cells.
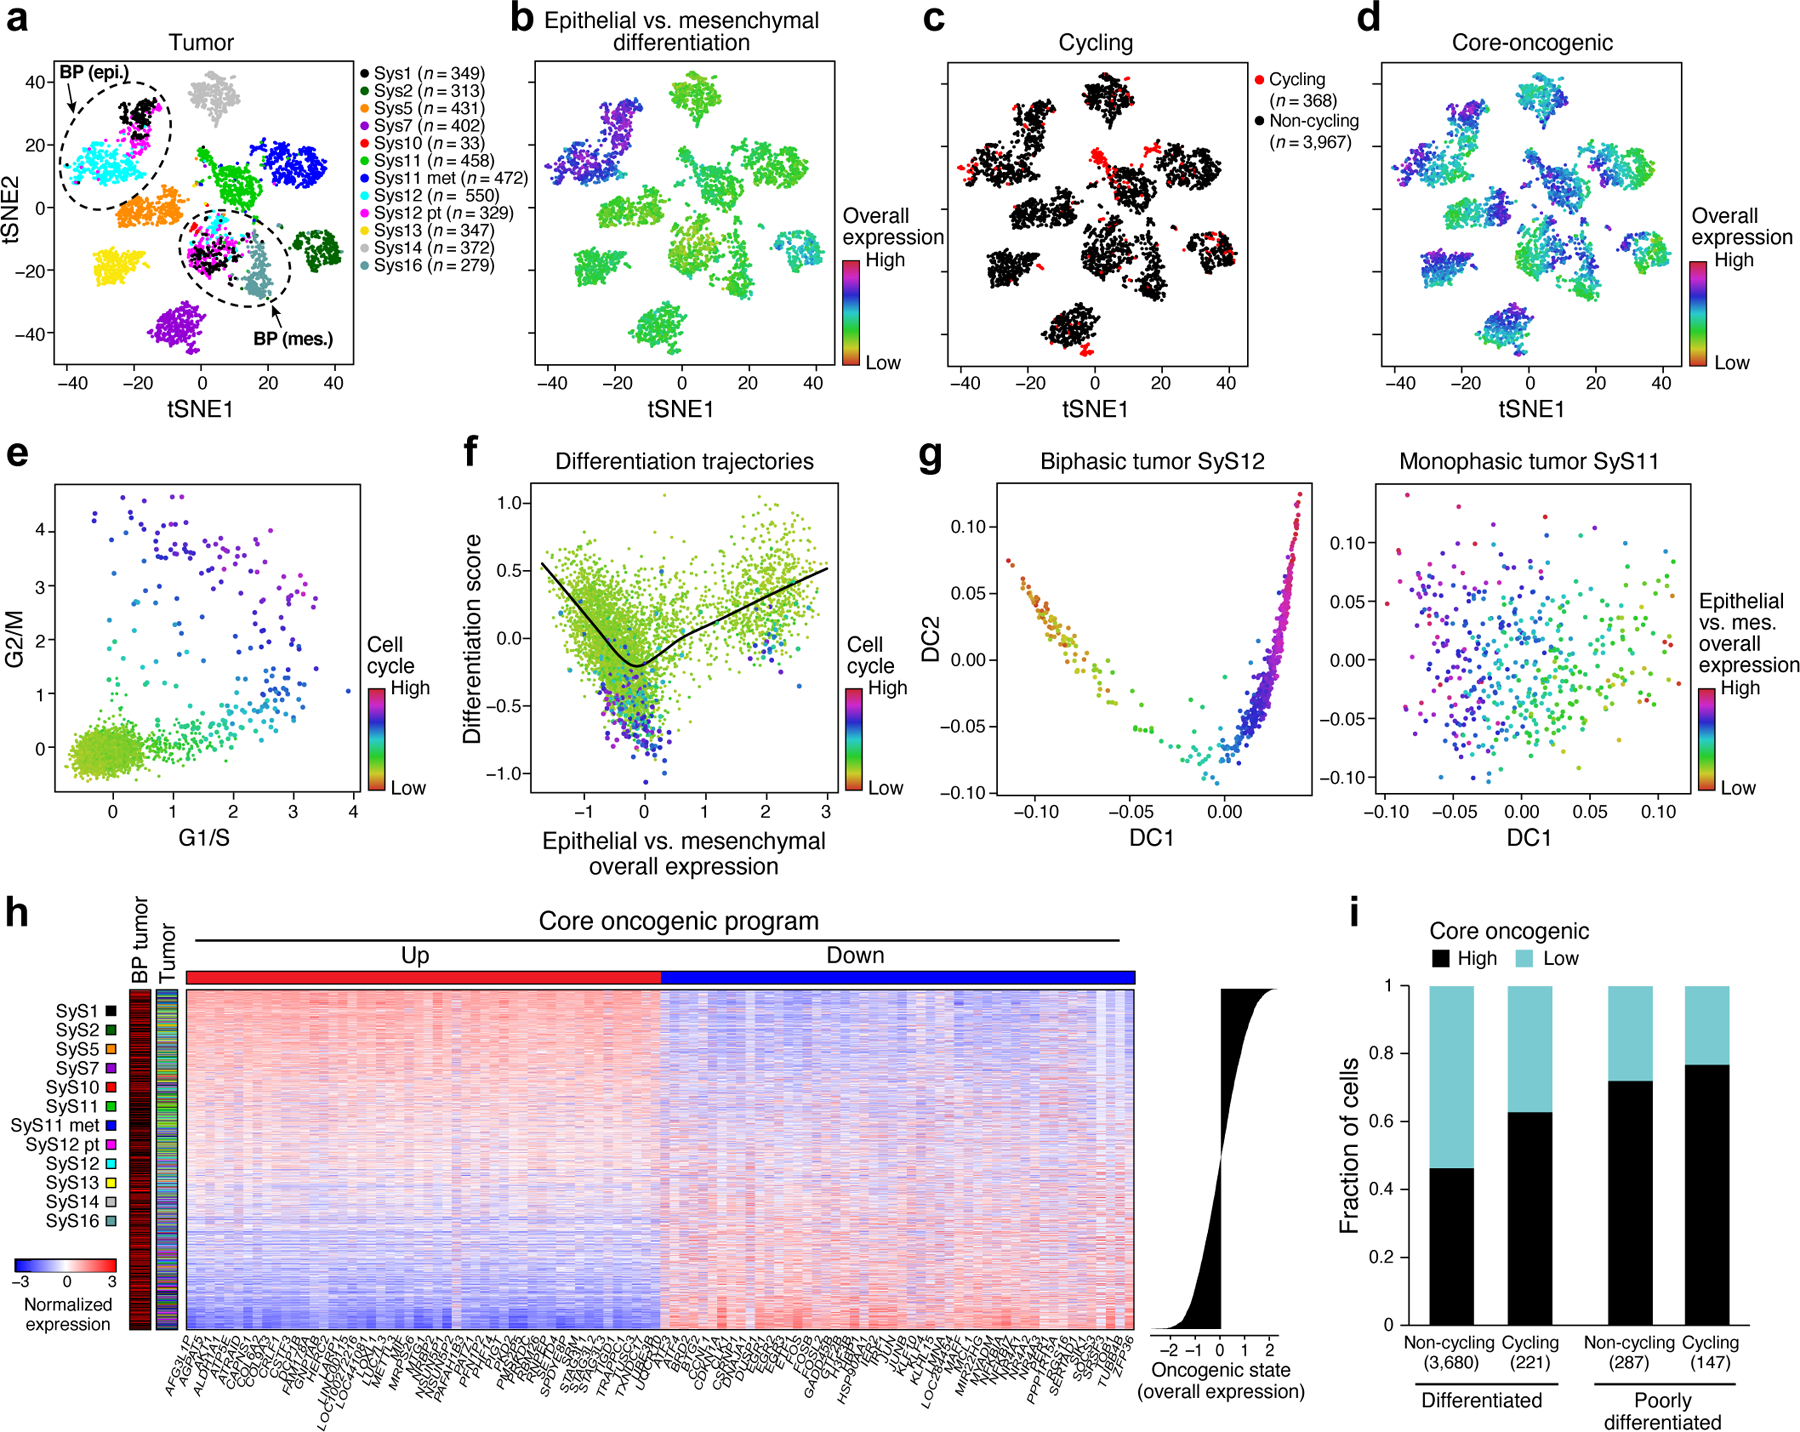
(a-d) De-differentiation, cell cycle, and the core oncogenic programs across malignant cells. t-SNE plots of malignant cell profiles (dots), colored by: (a) sample, (b) Overall Expression of the epithelial vs. mesenchymal differentiation program, (c) cell cycle status, or (d) Overall Expression of the core oncogenic program. Dashed ovals (A): mesenchymal and epithelial malignant subpopulations of biphasic (BP) tumors or poorly differentiated (PD) tumor. (e, f) Association between cell cycle and poor differentiation. (e) G1/S (x axis) and G2/M (y axis) phase signature scores for each cell. (f) Epithelial and mesenchymal-like differentiation. Scatter plots of the malignant cells’ (dots) scores for the epithelial vs. mesenchymal program (x axis) and for overall differentiation (y axis). Color: expression of cell cycle program (see also Extended Data Fig. 2b, c). (g) Distinct differentiation pattern in biphasic tumors. Single cell profiles dots arranged by the first two diffusion-map components (DCs) for representative examples of a biphasic (SyS12, left) and monophasic (SyS11, right) tumors, and colored by the Overall Expression of the epithelial vs. mesenchymal programs (colorbar). (h) Core oncogenic program genes. Normalized expression (centered TPM values, colorbar) of the top 100 genes in the core oncogenic program (columns) across the malignant cells (rows), sorted according to the Overall Expression of the program (bar plot, right). Leftmost color bars: biphasic tumor and sample ID. (i) The program is expressed in a higher proportion of cycling and poorly differentiated cells. Fraction of malignant cells (y axis) with a high (above median, black) and low (below median, blue) Overall Expression of the core oncogenic program, in cells stratified by cycling and differentiation status (x axis).