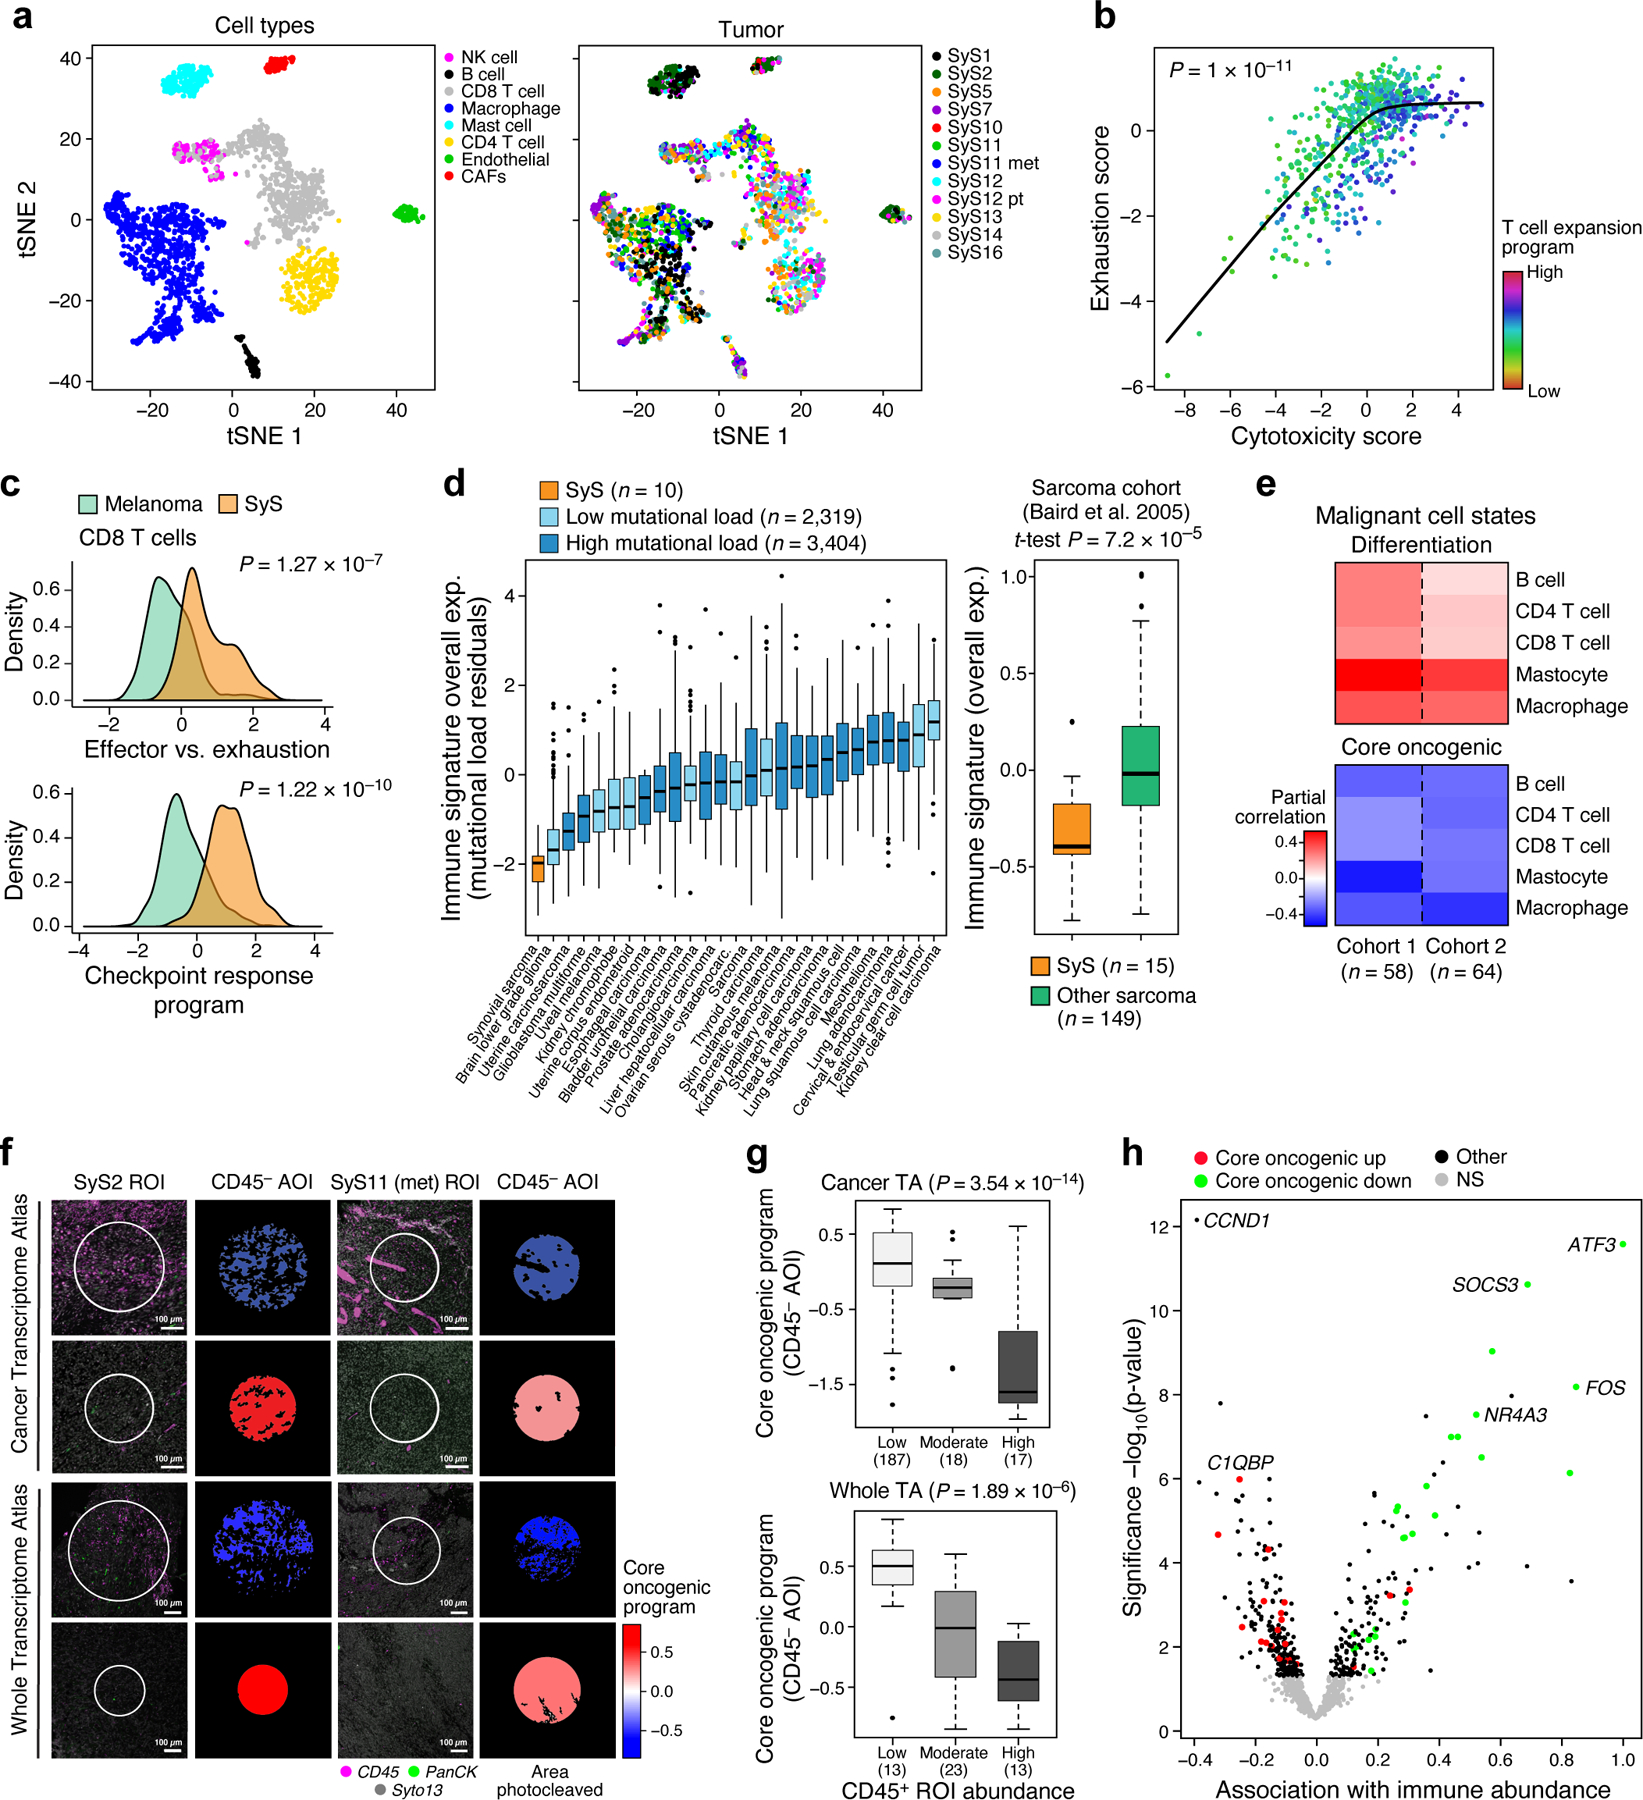
Fig. 4. Limited immune infiltration and features of anti-tumor immunity in SyS tumors.

(a) t-SNE of immune and stroma cell profiles (dots), colored by inferred cell type (left) or sample (right). (b) Cytotoxicity (x axis) and exhaustion (y axis) scores of SyS CD8 T cells, colored by the T cell expansion program score. The latter is associated with high cytotoxicity and lower than expected exhaustion (P < 1*10−11, mixed-effects). (c) Distribution of effector vs. exhaustion scores (top) or an immune checkpoint blockade responsiveness program39 (bottom) in CD8 T cells from SyS (orange) and melanoma (green); p-value: mixed-effects test. (d) Overall Expression of the immune signatures (y axis) in SyS tumors (orange) and other cancer types (controlling for variation in the mutational load, left panel) or other sarcomas (right panel). (e) Inferred level of immune cell types is associated with the malignant programs in bulk SyS tumors, when controlling for tumor purity. Partial correlation (colorbar) between the inferred level of each immune subset (rows) and the core oncogenic and differentiation levels (columns). (f-h) GeoMx Cancer Transcriptome Atlas (TA) and Whole Transcriptome Atlas in situ profiling reveals that the core oncogenic program (COP) is associated with reduced immune infiltrates. (f) Representative CD45+ staining in COP-high and COP-low tumor niches; the trend was observed across 244 ROIs in 9 SyS tumors, as shown in (g) and (h); (g) the expression of the COP in malignant CD45− AOIs stratified according to the immune cell abundance in the pertaining ROI, with no. of ROIs in parenthesis; p-values: mixed-effects test. (h) association gene expression in malignant CD45− AOIs with immune abundance in the pertaining ROI. (d) and (g) middle line: median; box edges: 25th and 75th percentiles, whiskers: most extreme points that do not exceed ±IQR*1.5; further outliers are marked individually.
