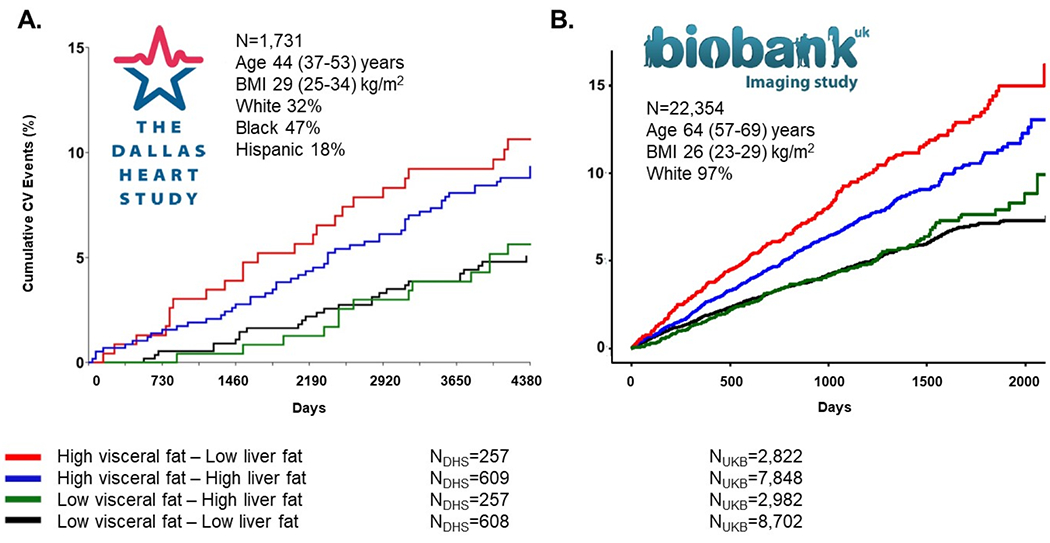
Figure 1. Kaplan-Meier curves of incident cardiovascular disease events stratified by body fat phenotype in the Dallas Heart Study (panel A) and UK Biobank study (panel B).

Incidence of CVD (y-axis) as a function of follow-up days (x-axis) in low VAT-low LF (black), high VAT-low LF (red), low VAT-high LF (green), and high VAT-high LF (blue) phenotypes in DHS (A) and UKB (B). High VAT/LF defined by median sex- and race-specific (black, non-black/Hispanic, non-Hispanic) values for VAT/LF in DHS and median sex-specific values for UKB. High VAT-low LF experienced the greatest rate of CVD events, while low VAT-high LF had rates of incident CVD similar to the referent group, low VAT-low LF.
