
Figure 2. Distribution of effector domains.
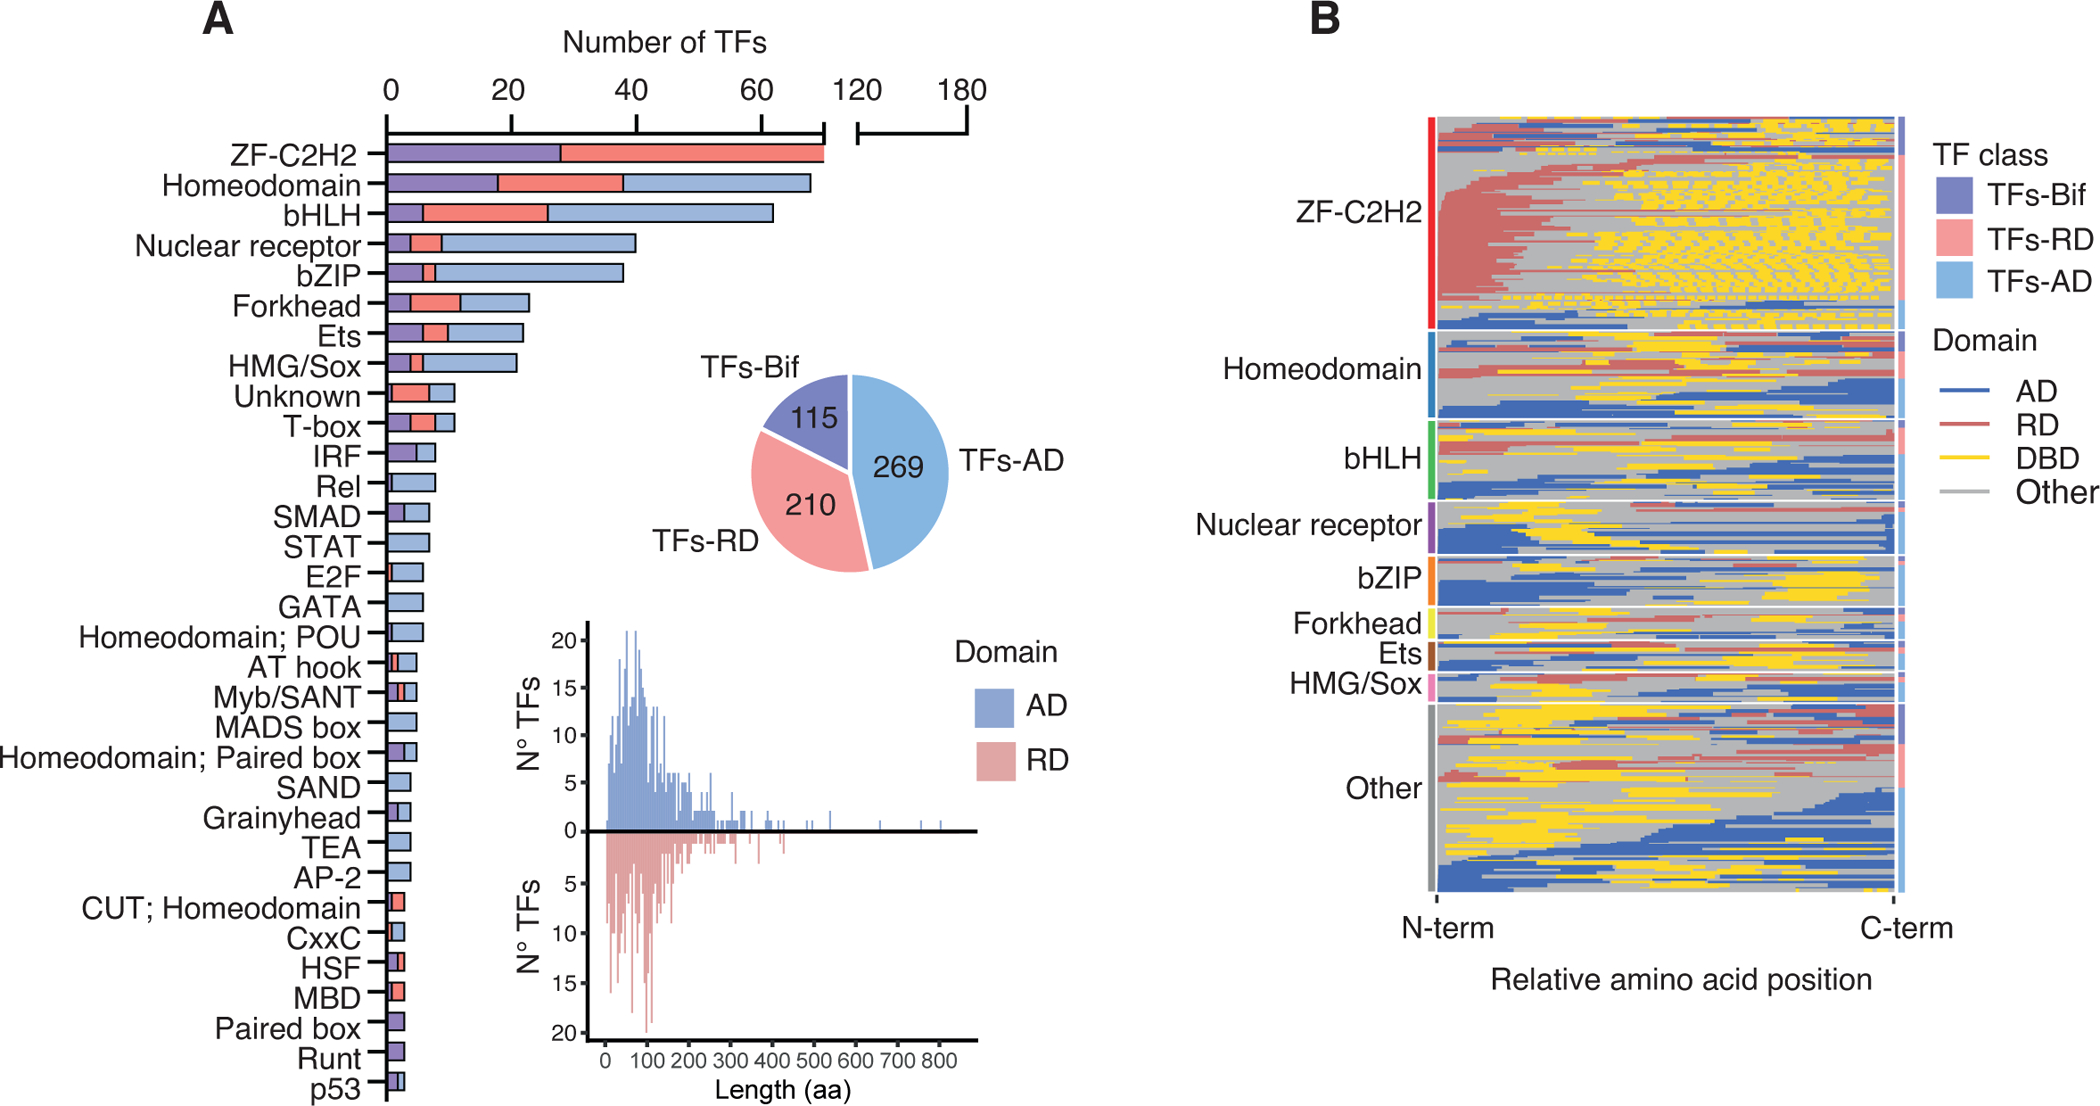
(A) Number of TFs per family with annotated effector domains classified as TFs-AD (if they only have ADs annotated), TFs-RD (if the only have RDs annotated), and TFs-Bif (if they have both ADs and RDs or bifunctional domains annotated). Only TF families with 3 or more annotated TFs are included. The pie chart indicates the number of TFs in each class. The histogram indicates the amino acid length distribution for ADs (blue) and RDs (red).
(B) Relative position of ADs, RDs and DBDs within the TF amino acid sequence (from N- to C-termini). TF families are indicated by the left bars. Within each family TFs are sorted based on whether they are classified as TFs-Bif, TFs-RD, or TFs-AD (indicated by the right bars). Within each class, TFs are sorted by the relative position of the effector domain in the TF sequence.
See also Figure S1.