
Figure 4. Effector domains affected in TF proteoforms.
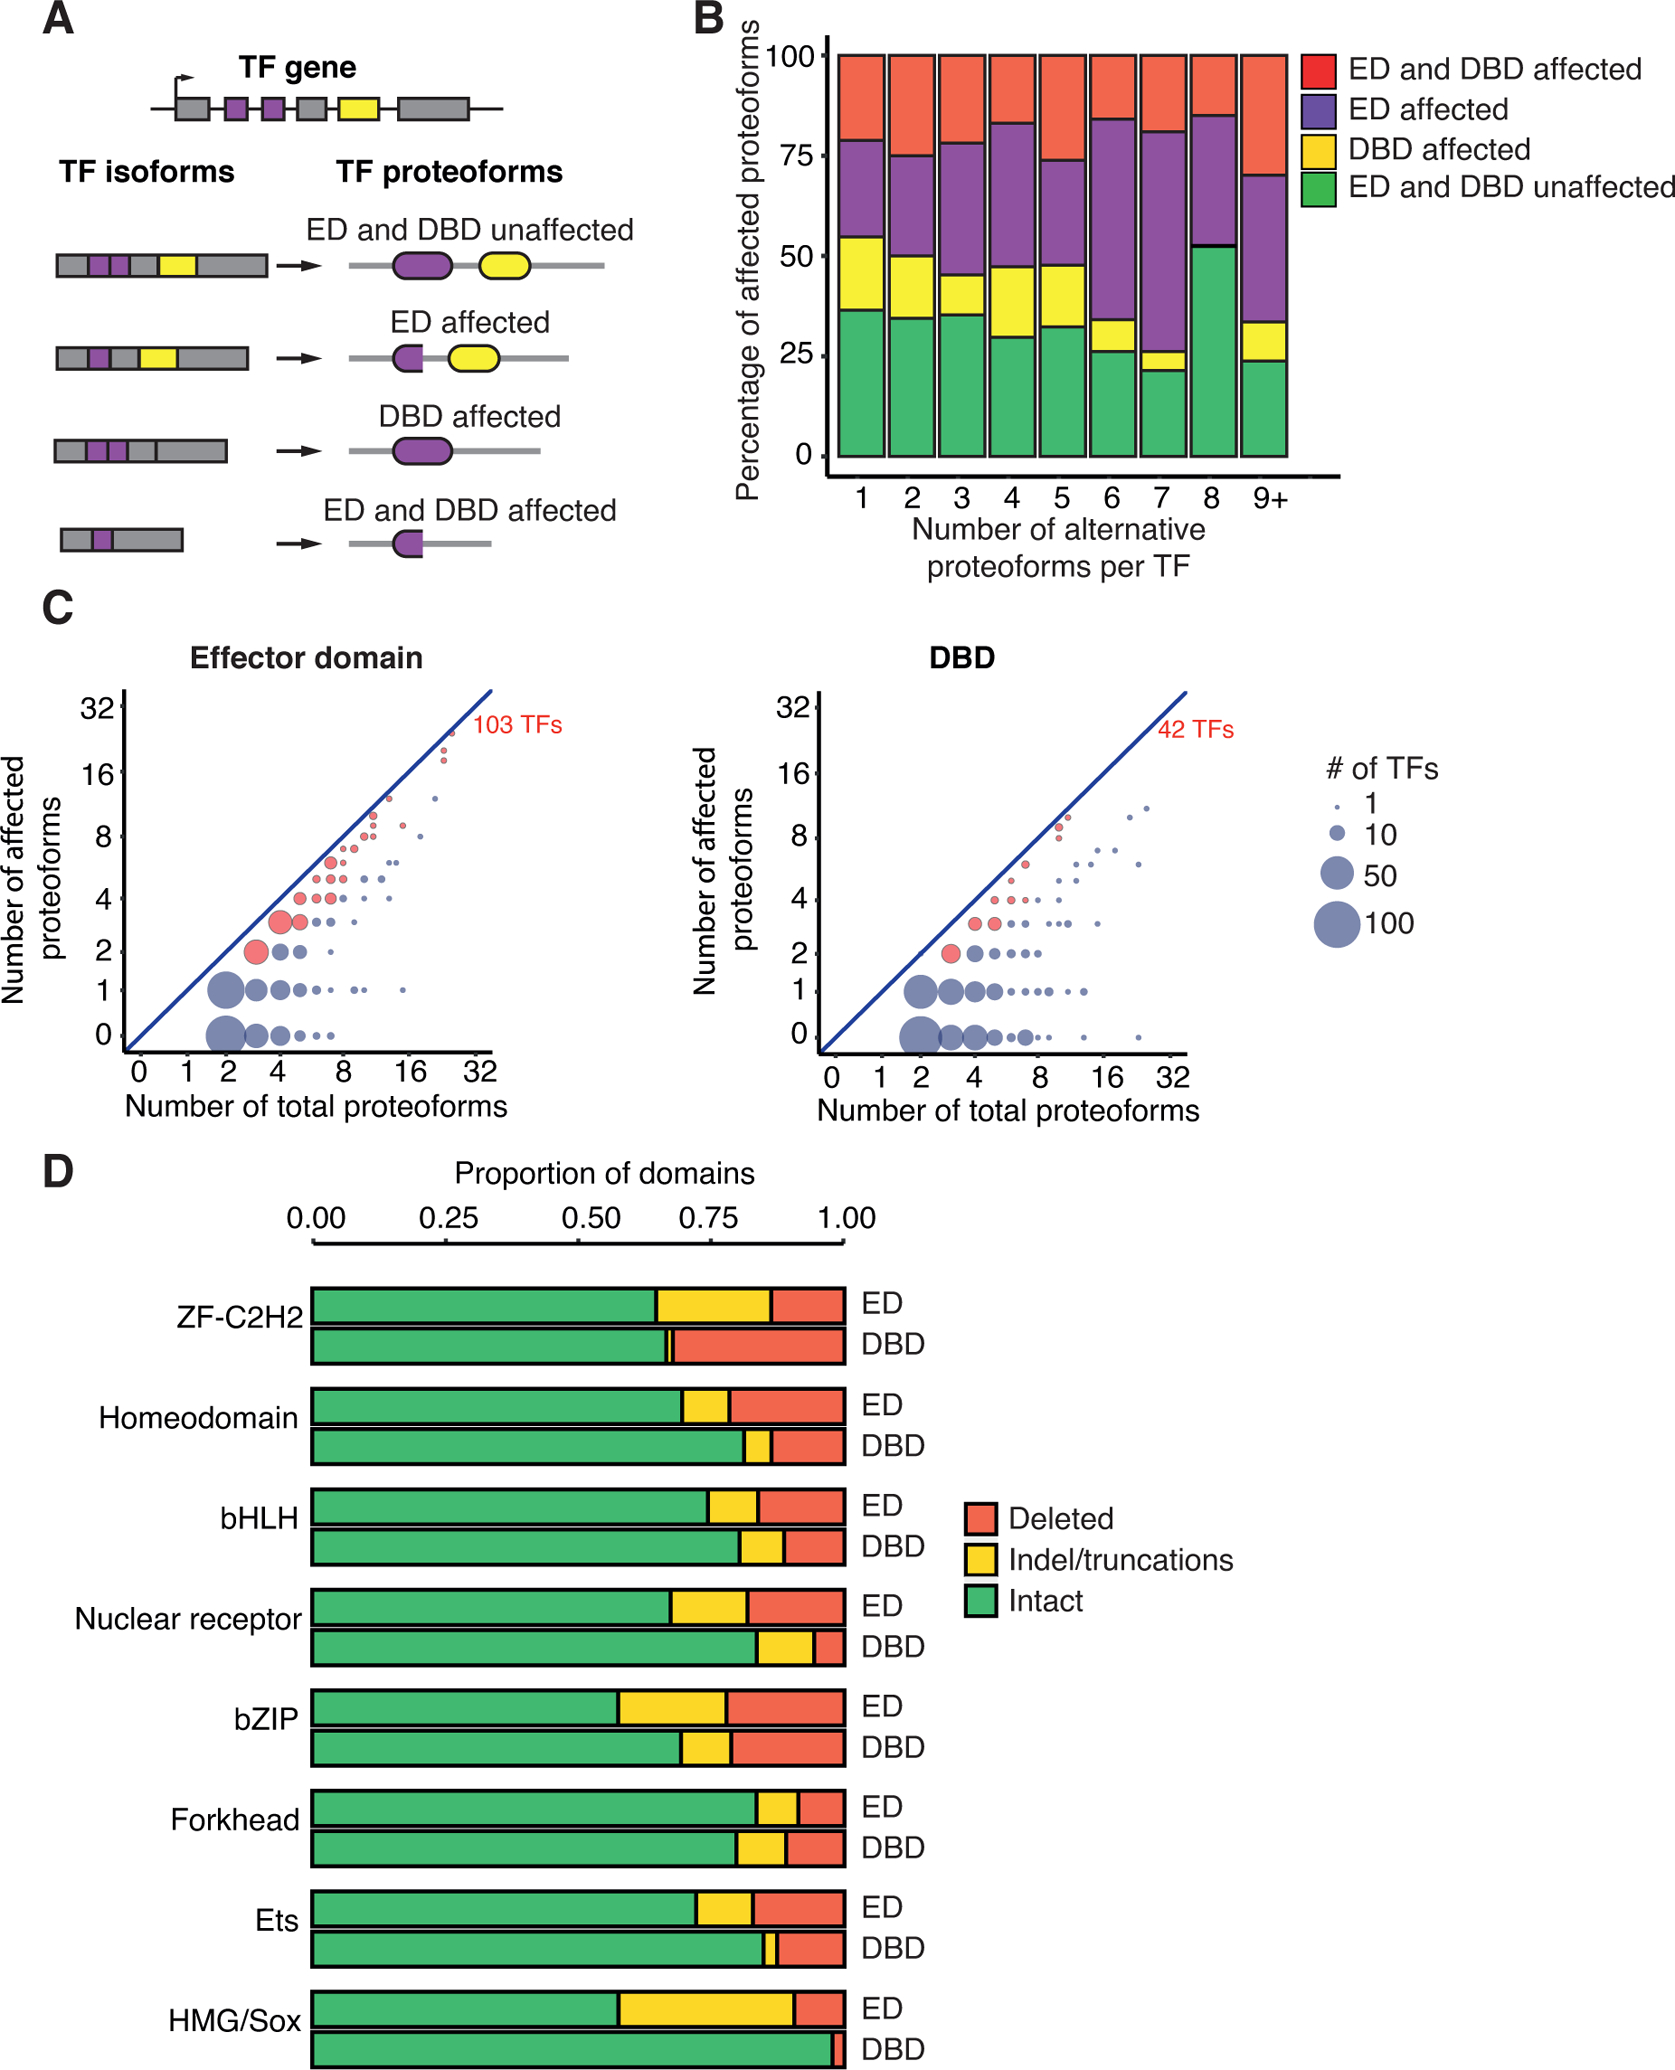
(A) Schematic of different proteoforms with effector domain (ED) affected, DBD affected, or with both domains affected o unaffected. Purple rectangles indicate ED coding exons; yellow rectangles indicate DBD coding exon; purple and yellow ovals indicate the ED and DBD, respectively.
(B) Fraction of proteoforms with effector domain (ED), DBD, or both domains affected. TFs are binned based on the number of alternative proteoforms.
(C) Comparison between the number of proteoforms where the effector domain (left) or the DBD (right) are affected versus the total number of proteoforms of a TF. The size of the circles indicates the number of TFs. Red circles indicate TFs with more that 50% of proteoforms with domain affected domain.
(D) Proportion of effector domains (ED) and DBDs where the domains are intact, have indels, or are deleted across proteofoms for each TF family.
See also Figure S4.