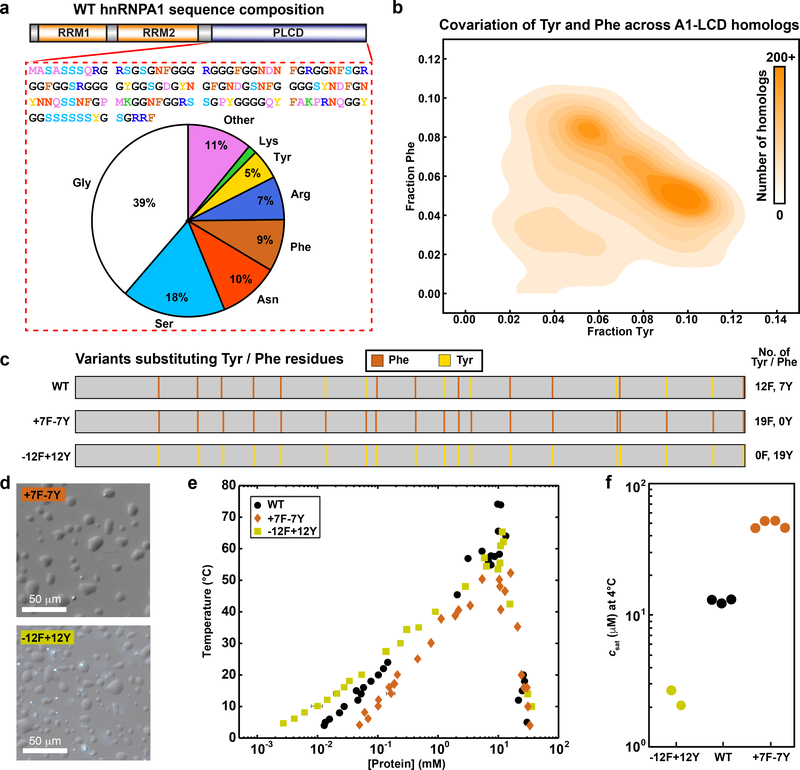
Fig. 1: Compositional analysis and covariation of aromatic content of hnRNPA1.
(a) Amino acid sequence and compositional statistics for the PLCD from isoform a of hnRNPA1 – referred to in the text as A1-LCD. (b) 2D histogram quantifying covariations in fractions of Tyr versus Phe residues across PLCDs. (c) Diagram of aromatic content type and placement in variants. Numbers next to each schematic indicate the number of residues of a certain type. Vertical bars in the schematics indicate the positions of Phe (brown) and Tyr (yellow) residues. (d) Differential interference contrast (DIC) images showing dense liquid droplets. Solution conditions were 20 mM HEPES, 150 mM NaCl, pH 7.0. (e) Binodals of A1-LCD variants as a function of temperature in 20 mM HEPES, 150 mM NaCl, pH 7.0. (f) A1-LCD variant saturation concentrations measured at 4°C.

