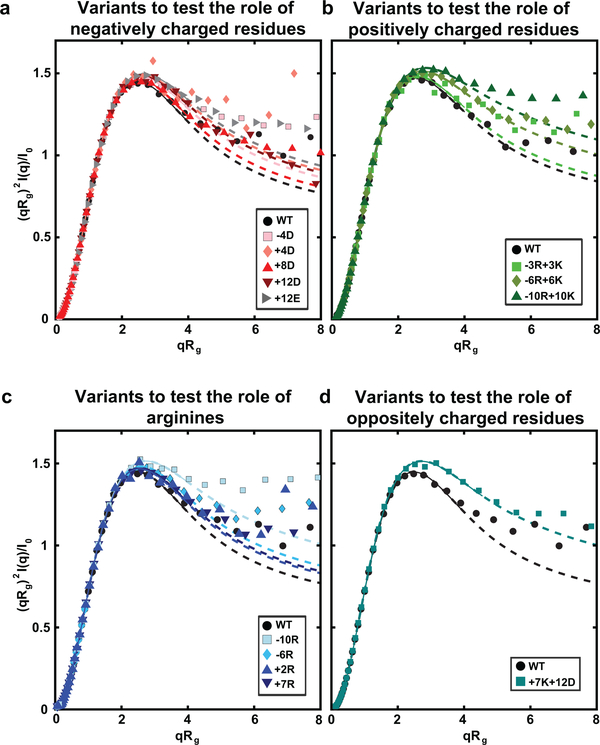
Extended Data Figure 5: Kratky plot of the raw SEC-SAXS of A1-LCD variants.
Data are shown for variants testing the roles of (a) negatively charged residues, (b) positively charged residues, (c) arginines, and (d) oppositely charged residues. Data were logarithmically smoothed into 40 bins. Solid lines are fits to system-specific empirical molecular form factors (MFF).

