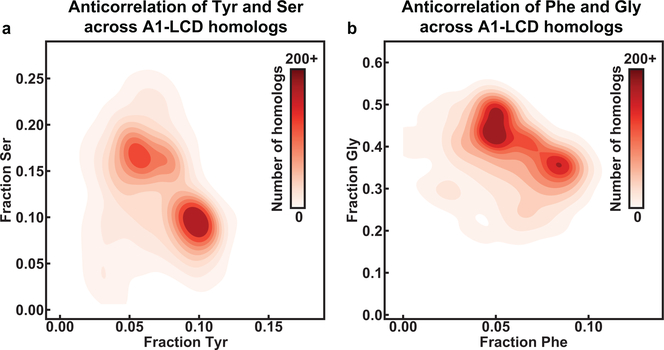
Extended Data Figure 6: Compositional analysis of aromatic stickers and Gly/Ser spacers.
(a) 2D histogram quantifying the joint distribution of the fractions of Tyr and Ser across PLCDs from 770 homologs of hnRNPA1. (b) 2D histogram quantifying the joint distribution of the fractions of Phe and Ser across PLCDs from 770 homologs of hnRNPA1. The solution conditions for all experiments were 20 mM HEPES, 150 mM NaCl, pH 7.0.

