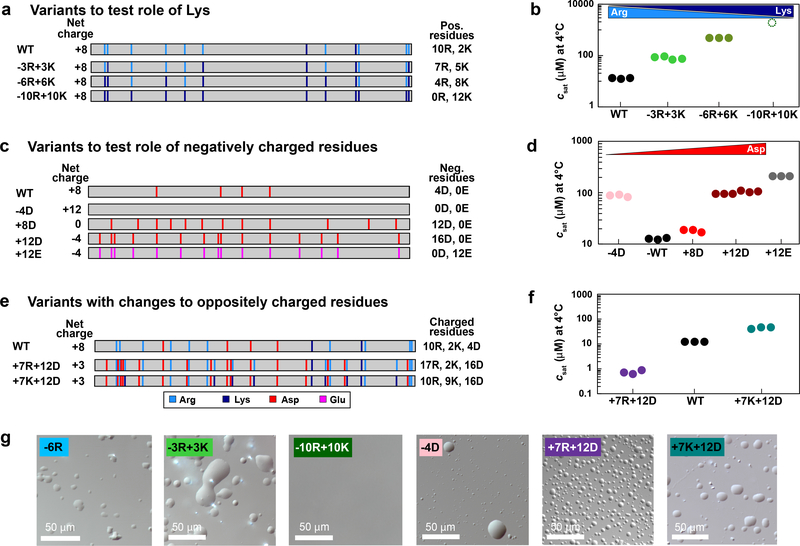
Fig. 4: Role of charged residues in PLCD phase separation.
(a) Diagram of Arg / Lys content and placement across variants that test the role of Lys residues. (b) Saturation concentrations of variants from (a) measured at 4°C. (c) Diagram of Asp/Glu content and placement in variants that test the role of negatively charged residues. (d) Saturation concentrations of variants from (c) measured at 4°C. (e) Diagram of Arg, Lys, Asp, and Glu content and placement in variants that test the role of oppositely charged residues. (f) Saturation concentrations of variants from (e) measured at 4°C. (g) DIC images showing dense droplets for select variants from Fig. 3 and 4. Solution conditions were 20 mM HEPES, 150 mM NaCl, pH 7.0. For binodals of variants see Supplementary Fig. 2.

