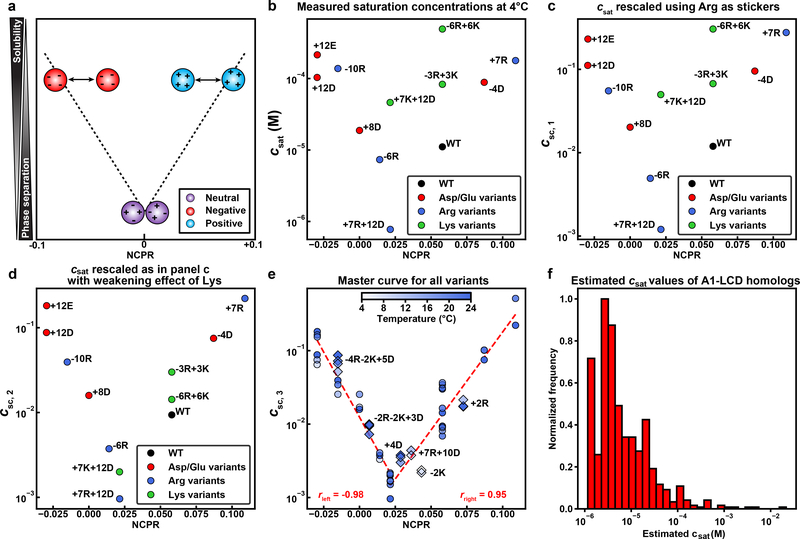
Fig. 5: NCPR modulates A1-LCD phase separation.
(a) Diagram illustrating the expected effect of net charge on driving force for phase separation. (b) csat values from data measured at 4 °C, plotted against NCPR for a subset of the sequence variants. Each data point is an average saturation concentration taken from at least 3 measurements at the given temperature. (c) Results of rescaling csat to account for the effects of Arg stickers. (d) Results of rescaling that accounts for the destabilizing effects of Lys in addition to accounting for the effects of Arg stickers. (e) Results of rescaling data using the approaches that lead to panels (b) and (c) combined with an accounting for the temperature-dependent variations to csat. The result is a master curve onto which all csat data for all measured temperatures collapse. The legends show the Pearson r-values that quantify the negative and positive linear correlations of the left and right arms, respectively. Variants not used for parameterization of the mean-field model were generated and their data shown as diamonds. (f) Histogram of calculated csat values for 770 PLCDs from the set of 848 sequences derived from hnRNPA1 homologs. These csat values were calculated using the mean-field model that yields csc,3 in (e).

