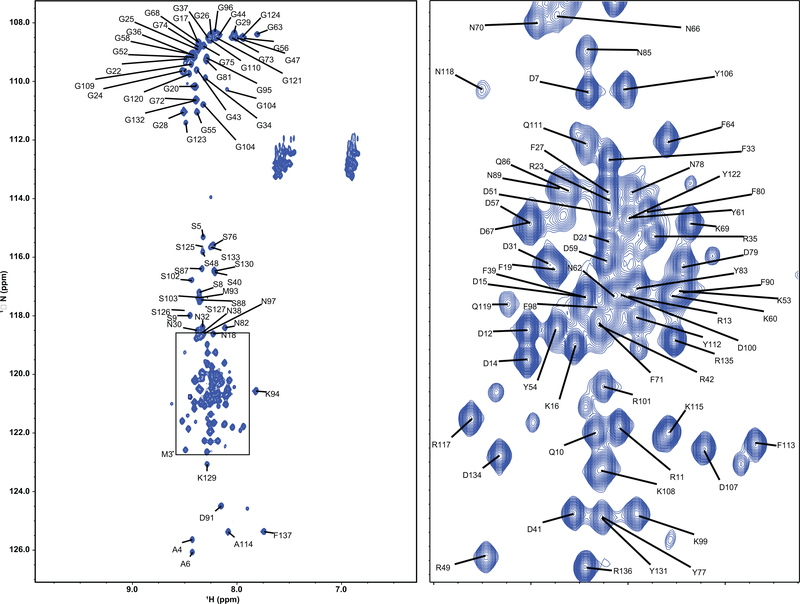
Extended Data Figure 2: 1H,15N HSQC spectrum of the A1-LCD variant +7K+12D.
The plot on the right is an expansion of a crowded area of the spectrum (indicated by a box on the left). Spectra were collected in homogenous samples in the absence of phase separation. The lack of chemical shift dispersion indicates that the protein remains primarily disordered. Despite the significant overlap, 80% of the amide chemical shifts were assigned to their respective amino acid residues (i.e., 110 of the 135 non-proline residues).

