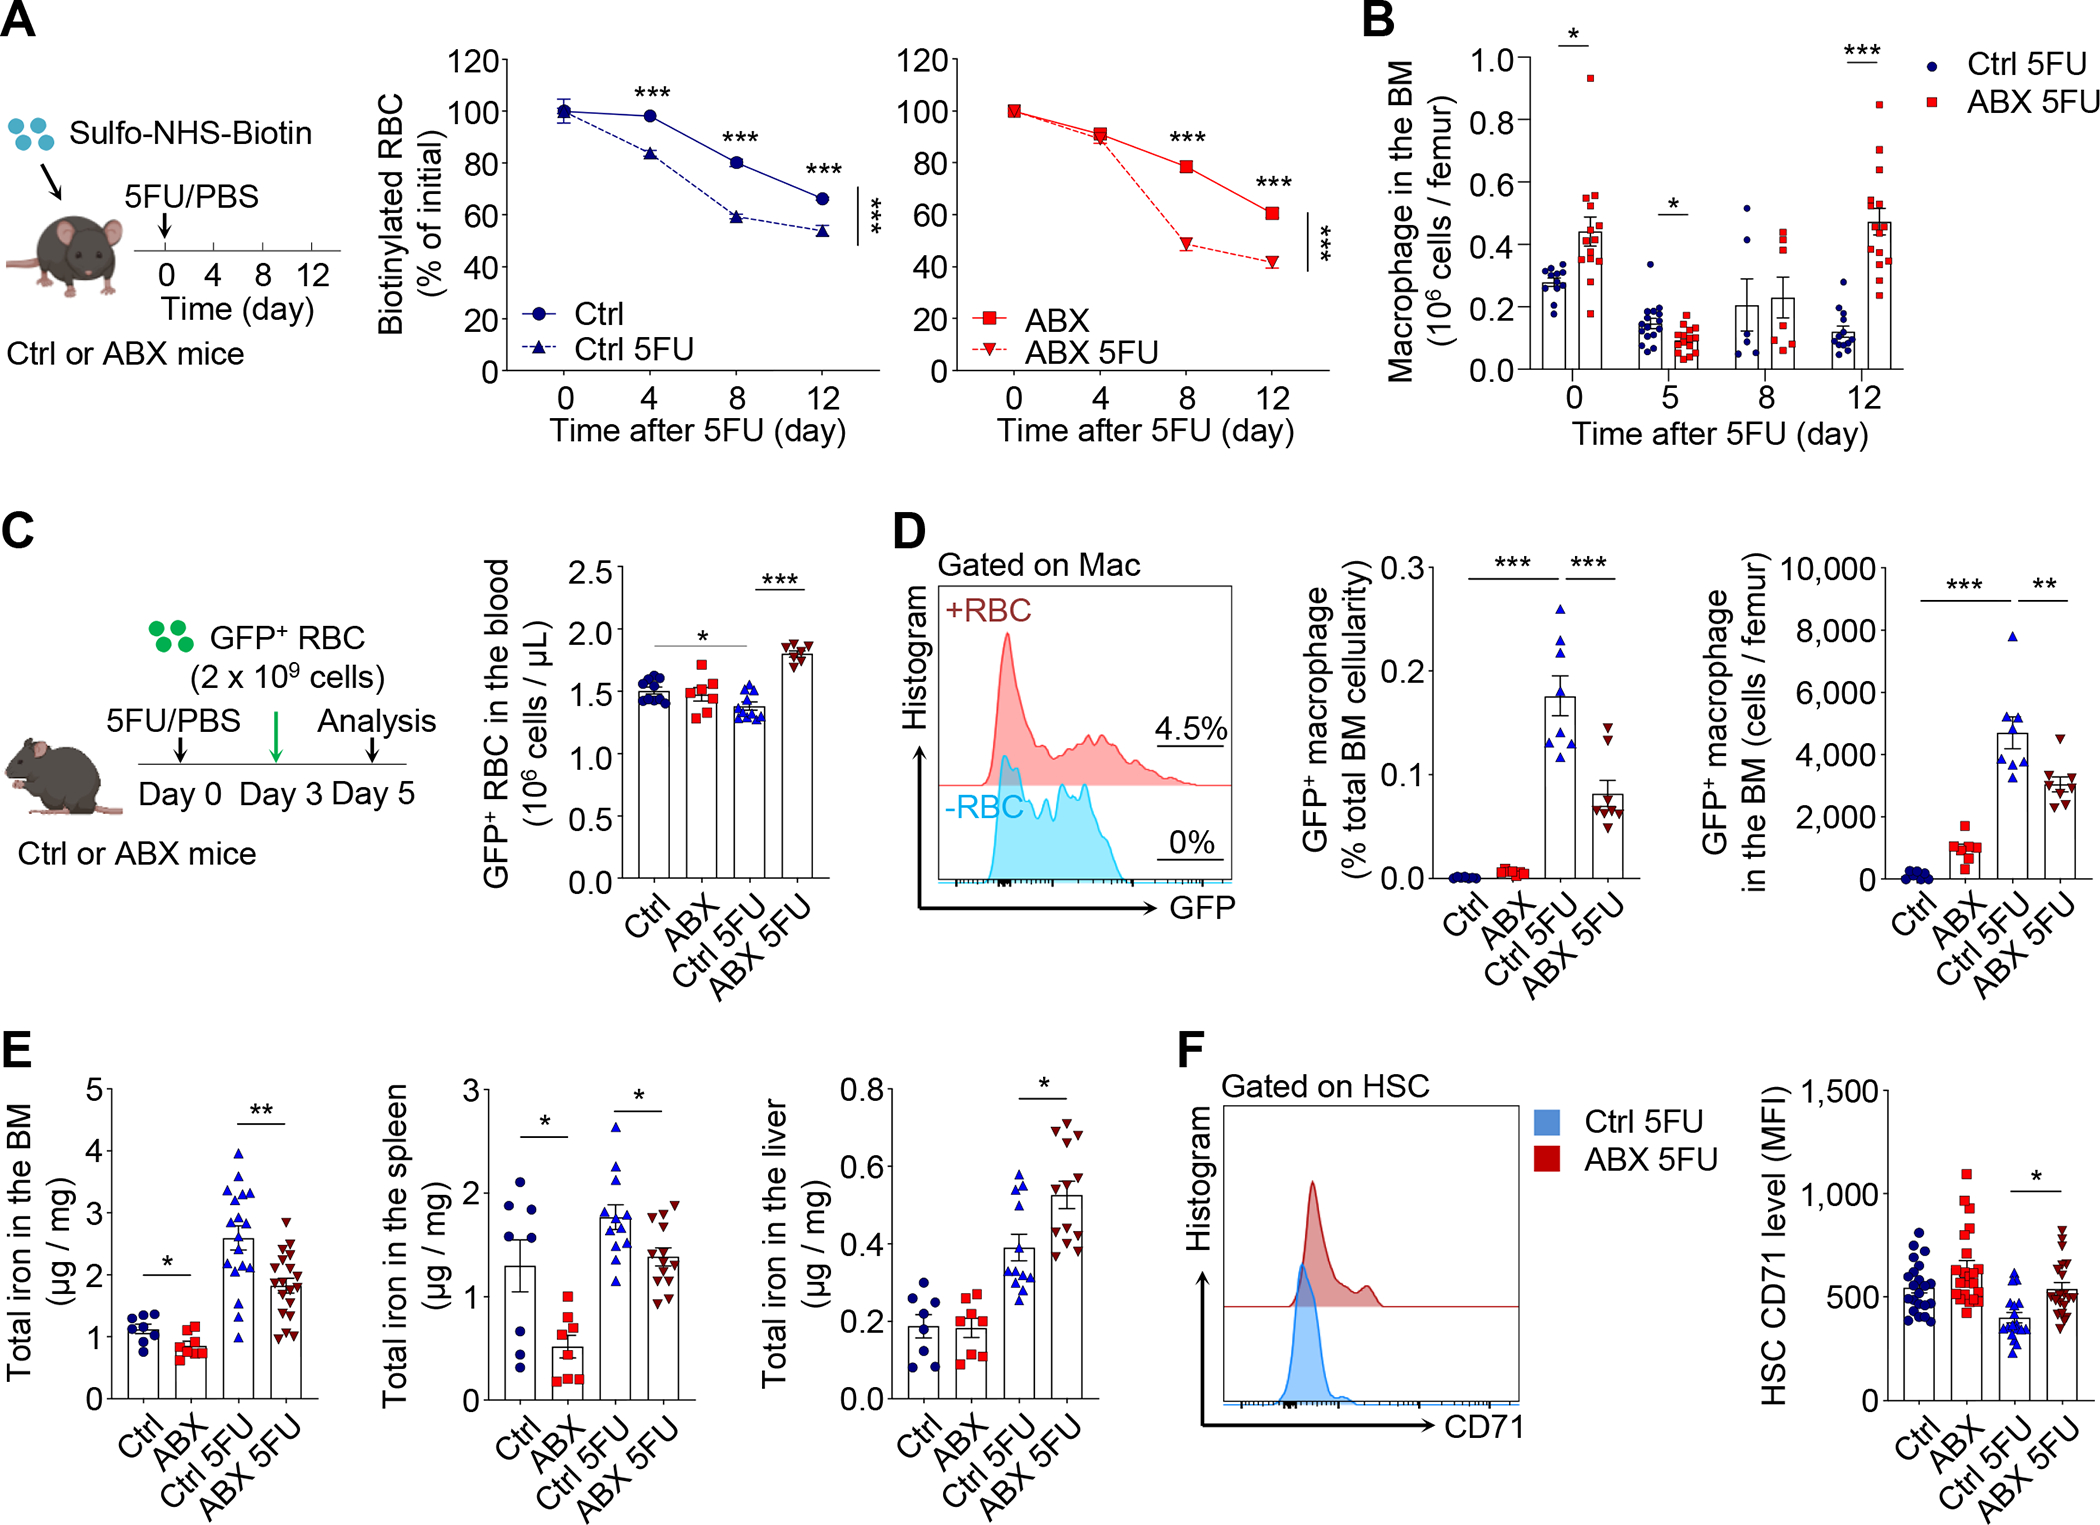
Figure 3. The microbiota regulates erythrophagocytosis and iron availability in the BM during regeneration.

(A) Biotin pulse-chase labelling to evaluate RBC clearance in control and ABX-treated mice after 5FU challenge (n = 4–10).
(B) Time-course analysis of macrophages in the BM of control and ABX-treated mice after 5FU challenge (n = 6–16). See also Figure S4B and S4C for gene expression analyses and splenic macrophages.
(C–D) Adoptive transfer of GFP+ RBCs to evaluate RBC clearance and phagocytosis by macrophages in the BM under steady state or in the early phase of regeneration (day 3–5; n = 7–11). See also Figure S4D–G for other tissues and later time points.
(E) Iron levels in the BM, spleen and liver of control and ABX-treated mice under steady state or at day 12 after 5FU challenge (n= 8–19).
(F) CD71 levels on HSCs in control and ABX-treated mice under steady state or at day 12 after 5FU challenge (n= 18–22). See also Figure S4H–J for germ-free and sublethal irradiation models.
* p < 0.05, ** p < 0.01, *** p < 0.001. Error bars, mean ± SEM.
See also Figure S4K for systemic iron parameters.
