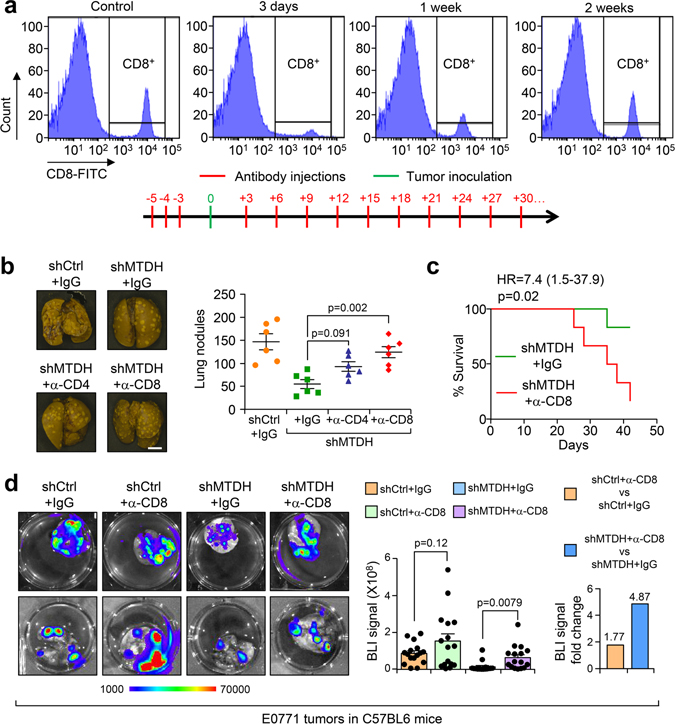
Extended Data Fig. 2. CD8+ T cells depletion partially restores MTDH knockdown induced metastatic inhibition.
a, FVB females were treated with 125 μg/mouse of anti-CD8 antibody or isotype control for 3 days. Peripheral blood was collected for flow cytometry analysis at indicated days after treatment (top). % of CD8+ cells in CD45+ populations are shown. Anti-CD8 antibody treatment scheme that used for the in vivo experiments in this study (bottom). b, 1×10⁶ E0771-shCtrl or shMTDH-1 (shMTDH hereafter) cells were injected into C57/BL6 females intravenously. The mice were subjected to isotype control or anti-CD4, anti-CD8 neutralizing antibodies treatment as in (a). 6 weeks after injection, the mice were euthanized, lungs were collected and fixed with Bouin’s solution. Representative lungs are shown and lung metastatic nodules were counted. n=6 mice per group. Size bar, 5 mm. Data represent mean ± SEM. Significance determined by one-way ANOVA analysis with Sidak’s’s test for multiple comparisons. c, Kaplan-Meier survival curve of C57/BL6 female mice injected with 1×10⁶ E0771-shMTDH that were treated with IgG or anti-CD8 neutralizing antibodies. n=6 mice per group. Significance determined by Log-rank test. d, 5×10⁵ -shCtrl or shMTDH E0771 cells were injected into the mammary fat pad of female C57BL6 mice, and the mice were treated with IgG or anti-CD8 neutralizing antibody as in (a). 6 weeks after injection, lungs were harvested and bioluminescent imaging (BLI) was performed to measure lung metastasis. Representative lungs (left), quantitative BLI signals (middle), and fold change of BLI signal between IgG and anti-CD8 groups (right) are shown. n=16 mice per group. Data represent mean ± SEM. Significance determined by two tailed Student’s t-test. Numerical source data for b, c, d, are provided.

