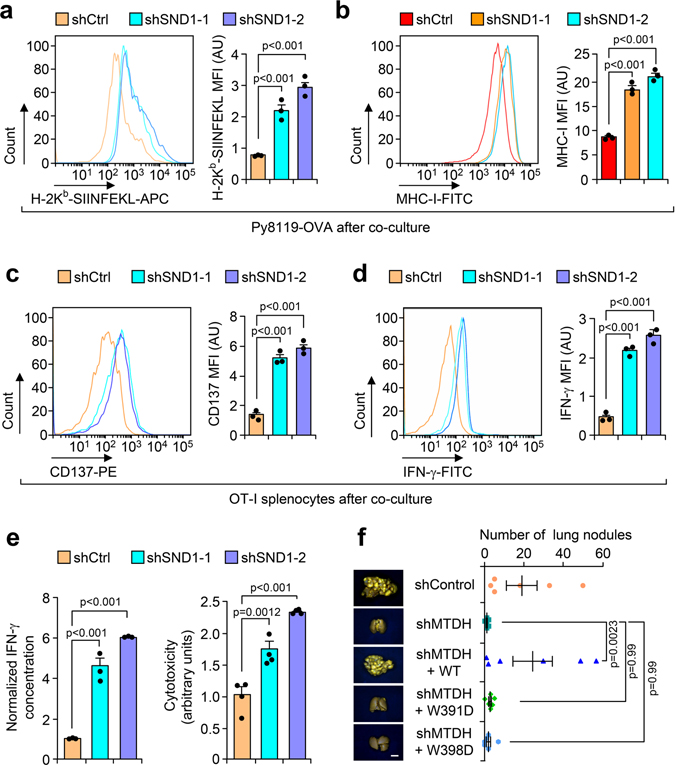
Extended Data Fig. 6. SND1 inhibits antigen presentation and T cell activation.
a-d, Py8119-OVA tumor cells (a,b) and OT-I splenocytes (c,d) after co-culture were collected to test OVA (H-2Kb-SIINFEKL) and MHC-I presentation, or CD137 and IFN-γ expression. MFI, mean fluorescence intensity; AU, arbitrary units. e, Media from (a) was employed for ELSA to test IFN-γ concentration and cytotoxicity assay. In panels from a-e, n=3 independent experiments. f, PyMT tumor cells with MTDH KD or indicated rescues were injected into FVB females intravenously. Five weeks after injection, lung metastatic nodules were counted, and representative lungs were shown. n=6 lungs per group. Data represent mean ± SEM. Significance determined by one-way ANOVA analysis with Dunnett’s test for multiple comparisons (a-e), or one-way ANOVA analysis with Sidak’s test for multiple comparisons (f). Numerical source data for a-f are provided.

