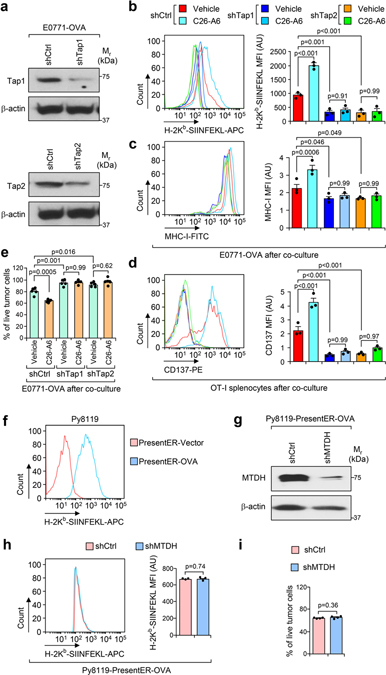
Extended Data Fig. 8. MTDH-SND1 complex promotes immune evasion through Tap1/2.
a, Western blot analyzing to confirm the knock down of Tap1/2 in E0771 cells (E0771-OVA) stably expressing luciferase and OVA after lentiviral transduction of respective shRNAs. b-d, E0771-OVA cells with (shTap1/2) or without (shCtrl) Tap1/2 knockdown were co-cultured with OT-I splenocytes with the ratio of 1:10 (tumor cells:splenocytes). 24 hr after co-culture, Tumor cells (b,c) and splenocytes (d) were collected for examining OVA (H-2Kb-SIINFEKL), MHC-I, and CD137 expression, respectively. MFI, mean fluorescence intensity; AU, arbitrary units. Data represent mean ± SEM. n=3 independent experiments. Significance determined by one-way ANOVA analysis with Sidak’s test for multiple comparisons. e, The same co-culture experiment as in (b) were performed. The live tumor cells were indicated by luciferase signal. The percentage of live cells were determined as normalized to the non-co-culture control. Data represent mean ± SEM. n=5 independent experiments. Significance determined by one-way ANOVA analysis with Sidak’s test for multiple comparisons. f, PresentER-Vector or PresentER-OVA (H-2Kb-SIINFEKL) system was stably expressed in Py8119 cells. The surface presentation of OVA (H-2Kb-SIINFEKL) was validated by flow cytometry analysis. g, Western blot analysis confirming the knock down of MTDH in Py8119 cells stably expressing luciferase and PresentER-OVA (Py8119-PresentER-OVA) after lentiviral transduction of respective shRNAs. h, Py8119-PresentER-OVA cells with (shMTDH) or without (shCtrl) MTDH knockdown were co-cultured with OT-I splenocytes with the ratio of 1:10 (tumor cells:splenocytes). 24 hr after co-culture, Tumor cells were collected for examining OVA (H-2Kb-SIINFEKL). Data represent mean ± SEM. n=3 independent experiments. Significance determined by two tailed Student’s t-test. i, The same co-culture experiment as in (h) were performed. The live tumor cells were indicated by luciferase signal. The percentage of live cells were determined as normalized to the non-co-culture control. Data represent mean ± SEM. n=3 independent experiments. Significance determined by two tailed Student’s t-test. Numerical source data for b-e, h, i and uncropped blots for a and g are provided.

