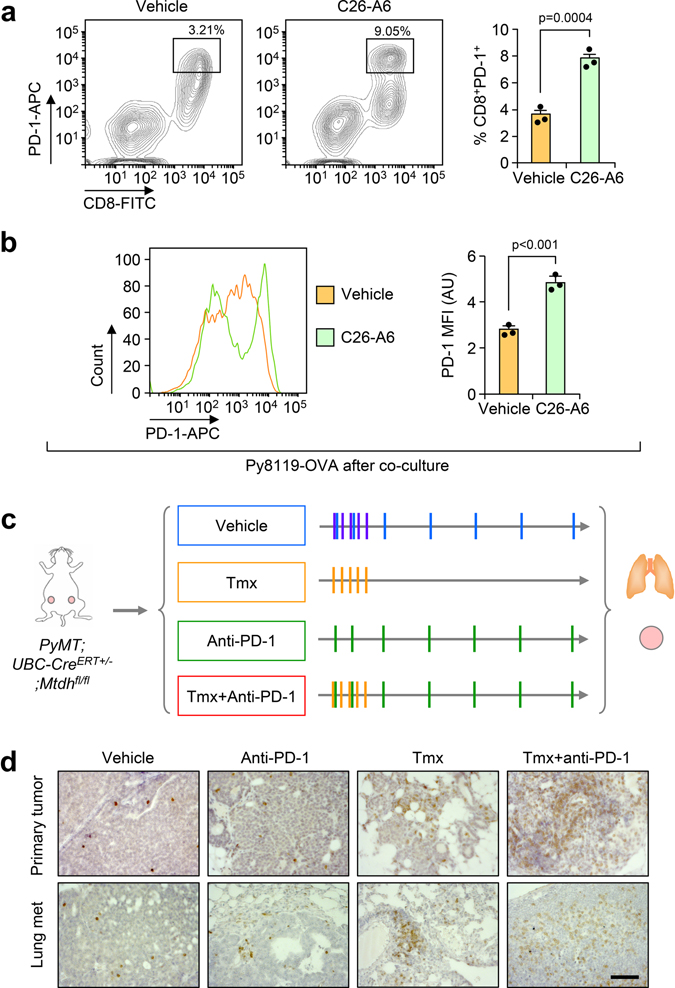
Extended Data Fig. 9. MTDH-SND1 disruption and anti-PD-1 treatment synergistically enhance anti-tumor immune response.
a, OT-I splenocytes were co-cultured with Py8119-OVA cells with or without 200 μM of C26-A6 treatment for 24 hr. The expression of PD-1 in CD8+ T cells was examined by flow cytometry. % of CD8+PD-1+ in live populations are shown. Data represent mean ± SEM. n=3 independent experiments. Significance determined by two tailed Student’s t-test. b, Cells in (a) were gated on the CD8+ T cell population and the mean fluorescence intensity (MFI) of PD-1 expression was measured. AU, arbitrary units. Data represent mean ± SEM. n=3 independent experiments. Significance determined by two tailed Student’s t-test. c, Schematic diagram of treatment. PyMT;UBC-CreERT+/−;Mtdhfl/fl females with tumors established were treated with Tmx and anti-PD-1 alone or in combination. Tmx, Tamoxifen, 60 mg/kg i.p. for 5 consecutive days; anti-PD-1, 200 μg/mouse i.p. injection, twice per week for the first week and then once per week after that. d, Primary tumors and lungs from experiment in Fig. 6c were fixed for CD8 IHC staining. Scale bar, 100 μm. Numerical source data for a and b are provided.

