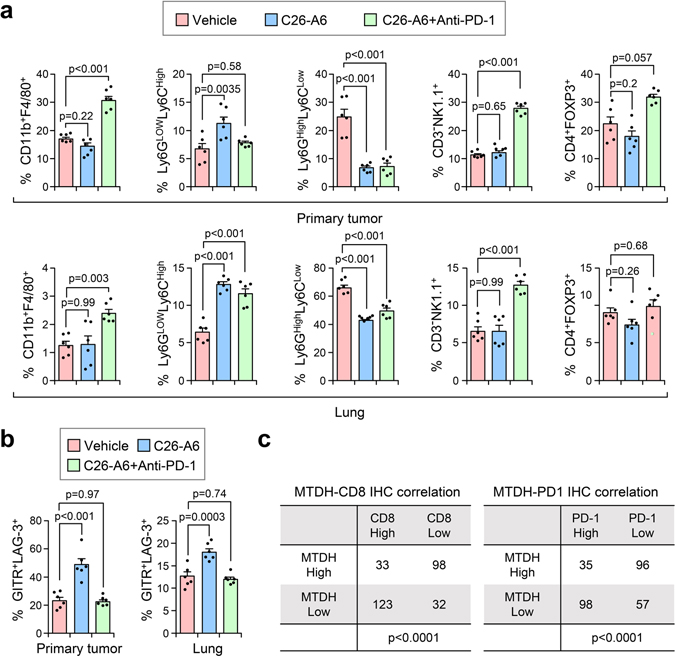
Extended Data Fig. 10. C26-A6 combined with anti-PD-1 treatment reshapes the tumor immune microenvironment.
a,b, 100k PyMT tumor cells were orthotopically injected into the mammary glands of FVB females. The mice were randomized and divided into three groups when primary tumors were established, followed by vehicle, C26-A6, or C26-A6+anti-PD-1 treatment. Six weeks after treatment, primary tumors and lung with metastatic lesions were collected for flow analysis with indicated antibodies. % of CD11b+F4/80+, Ly6GlowLy6Chigh, Ly6GhighLy6Clow, CD3-NK1.1+ in CD45+ population are shown. % of CD4+FOXP3+ in CD3+ population are shown, and % of GITR+LAG-3+ in CD8+ population are shown. Anti-PD-1, 200 μg/mouse i.p. injection, twice per week for the first week and then once per week after that; C26-A6, 15 mg/kg i.v. injection, 5 days per week. n=6 mice per group. Data represent mean ± SEM. Significance determined by one-way ANOVA analysis with Dunnett’s test for multiple comparisons. c, Negative correlation between MTDH expression and CD8+ T cell infiltration or PD-1 expression in TNBC patients. Representative IHC images are shown in Fig. 8a. p-value by two-sided chi square test tests. Numerical source data for a and b are provided.

