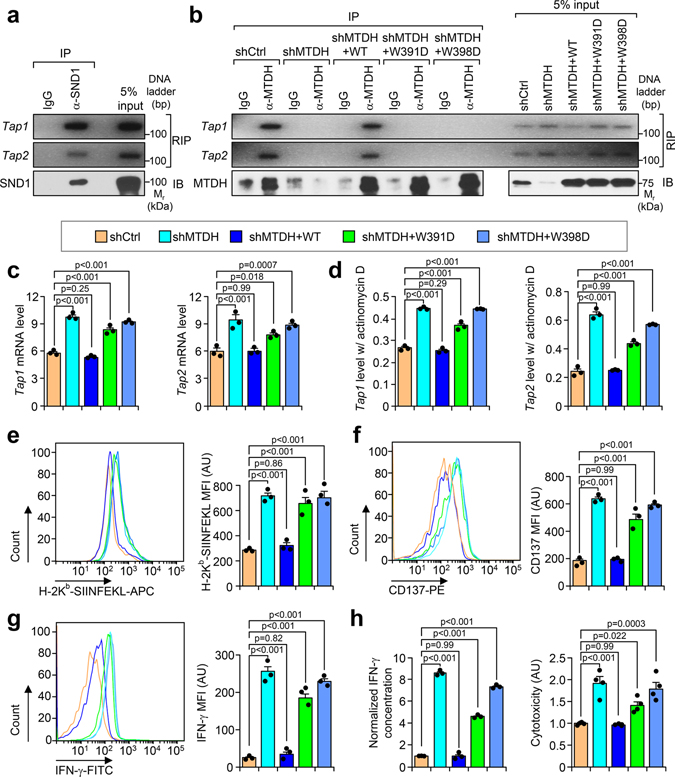
Fig. 4. MTDH forms complex with SND1 to inhibit tumor antigen presentation and T cell activation.
a, Py8119-OVA cells were co-cultured with OT-1 splenocytes for 24 hr, and then collected for RIP assay. SND1 pull-down was confirmed by immunobloting (IB). The binding RNA was extracted, and Tap1/2 was amplified with PCR. b, Py8119-OVA cells with endogenous Mtdh KD (shMTDH) and indicated rescues (shMTDH+WT, +W391D, or +W398D) were co-cultured with OT-1 splenocytes for 24 hr, and then collected for RIP assay. MTDH protein pull-down was confirmed by immunobloting (IB). The binding RNA was extracted, and Tap1/2 was amplified with PCR. WT, wildtype MTDH; W391D and W398D, SND1 interaction-deficient mutants MTDH-W391D and MTDH-W398D. c, Indicated Py8119-OVA cells co-cultured with OT-1 splenocytes for 24 hr were harvested for RNA extraction. Levels of Tap1/2 were determined by qRT-PCR. d, Indicated Py8119-OVA tumor cells co-cultured for 24 hr were treated with 10 μg/ml of actinomycin D. 8 hr after treatment, RNA levels of Tap1/2 were determined by qRT-PCR. e-g, Indicated Py8119-OVA tumor cells (e) and OT-1 splenocytes (f,g) after co-culture were collected to test the OVA (H-2Kb-SIINFEKL) presentation on tumor cells, or CD137 and IFN-γ expression in splenocytes. MFI, Mean Fluorescence Intensity; AU, arbitrary units. h, Media from (e) was employed for ELSA to test IFN-γ concentration and cytotoxicity assay. AU, arbitrary units. In all panels data represent mean ± SEM. n=3 independent experiments. Significance determined by one-way ANOVA analysis with Dunnett’s test for multiple comparisons. Numerical source data for c-h and uncropped images for a, b are provided.

