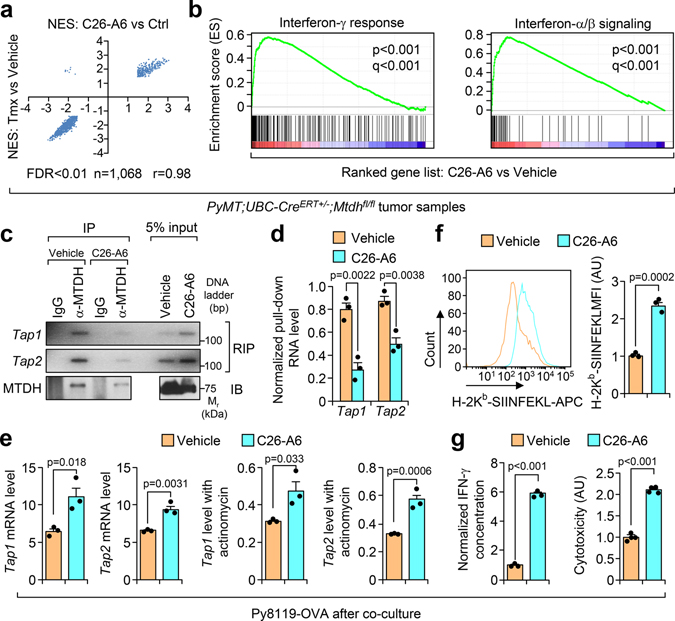
Fig. 5. MTDH-SND1 blocking activates T cells by enhancing antigen presentation in tumors.
a, The correlation of the gene sets that significantly enriched (FDR<0.01) in Mtdh acute loss and C26-A6 treated tumors. Tmx, Tamoxifen. b, Gene set enrichment analysis showing the enrichment of interferon signatures in C26-A6 treated PyMT tumors as compared to control PyMT tumors. p and q values automatically determined by GSEA 3.0. c, Py8119-OVA cells co-cultured with OT-I splenocytes were treated with 200 μM of C26-A6 or same amount of vehicle. The binding between MTDH and Tap1/2 in tumor cells were determined by RIP assay. d, Tap1/2 RNAs that bind to MTDH in (c) were quantified and normalized to the pulled down MTDH levels. e, Tap1/2 levels in Py8119-OVA cells with/without 200 μM of C26-A6 treatment during co-culture were examined by qRT-PCR. f, OVA (H-2Kb-SIINFEKL) presentation in Py8119-OVA cells with/without 200 μM of C26-A6 treatment in co-culture were determined by flow cytometry. MFI, Mean Fluorescence Intensity; AU, arbitrary units. g, Media in (E) was collected for IFN-γ ELISA and cytotoxicity assay. AU, arbitrary units. In panels c-g, data represent mean ± SEM. n=3 independent experiments. Significance determined by two tailed Student’s t-test. Numerical source data for a, d-g and uncropped images for c are provided.

