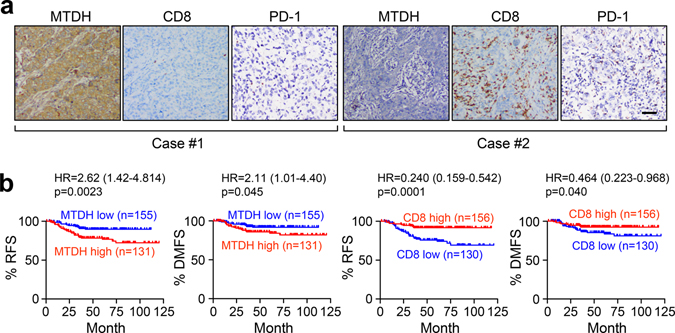
Fig. 8. MTDH expression negatively correlates with CD8+ T cell infiltration and PD-1 expression in TNBC patients.
a, IHC staining shows negative correlation between MTDH expression and CD8+ T cell infiltration or PD-1 expression in primary tumors from TNBC patients. n=286 patients. Representative images were shown. Scale bar, 100 μm. b, Kaplan-Meier plot of relapse free survival (RFS) and distant metastasis free survival (DMFS) of TNBC patients stratified by MTDH protein levels and infiltrated CD8+ T cells. p-value by two-sided Log-rank test.

