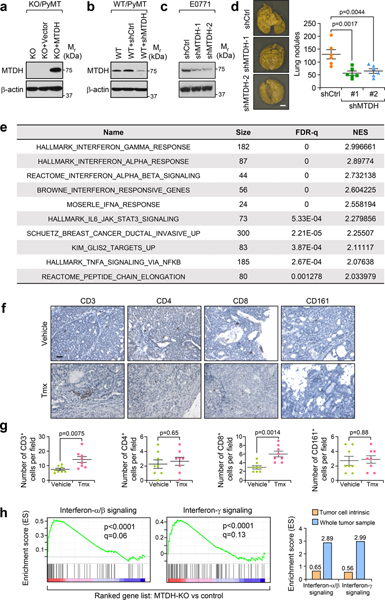
Extended Data Fig. 1. MTDH depletion reshapes immune cell populations in tumors.
a, KO/PyMT cells were rescued with vector or wild type MTDH. The expression of MTDH was validated by western blot. b, Western blot analysis of endogenous MTDH knockdown in WT/PyMT cells. c, Western blot analysis of endogenous MTDH knockdown in E0771 cells with stable luciferase expression. d, 1×10⁶ of E0771 cells with (shMTDH-1, −2) or without (shCtrl) MTDH knockdown were injected into female C57/BL6 mice via tail-vein. 6 weeks after injection, lungs were collected (left) and metastatic nodules were counted (right). n=6 mice per group. Size bar, 5 mm. Data represent mean ± SEM. Significance determined by one-way ANOVA analysis with Dunnett’s test for multiple comparisons. e, PyMT;UBC-CreERT+/−;Mtdhfl/fl mice with tumors established were treated with vehicle or Tamoxifen (Tmx) for five consecutive days. One week after the treatment, tumors were collected, and RNA was extracted for RNA sequencing. Gene sets that are significantly enriched in ranked gene list of Tmx treated versus control cells. n=4 mice per group. f,g, Tumors from PyMT;UBC-CreERT+/−;Mtdhfl/fl mice treated with vehicle or Tmx were collected for immunohistochemistry (IHC) staining with indicated antibodies (f). The numbers of positive cells per field were quantified (g). Size bar, 50 μm. Data represent mean ± SEM. n=8 fields from 4 mice in each group. Significance determined by two tailed Student’s t-test. h, PyMT;UBC-CreERT+/−;Mtdhfl/fl tumorspheres were treated with vehicle (Ctrl) or 4-Hydroxytamoxifen (4-OHT) (MTDH-KO). The spheres were then collected for RNA sequencing. Gene set enrichment analysis demonstrates the enrichment of the indicated gene sets. p and q values automatically determined by GSEA 3.0. The enrichment scores of the indicated signatures from tumorspheres in vitro or tumor samples in vivo (Fig. 1e) were presented (right). Numerical source data for d, g, and uncropped blots for a-c are provided.

