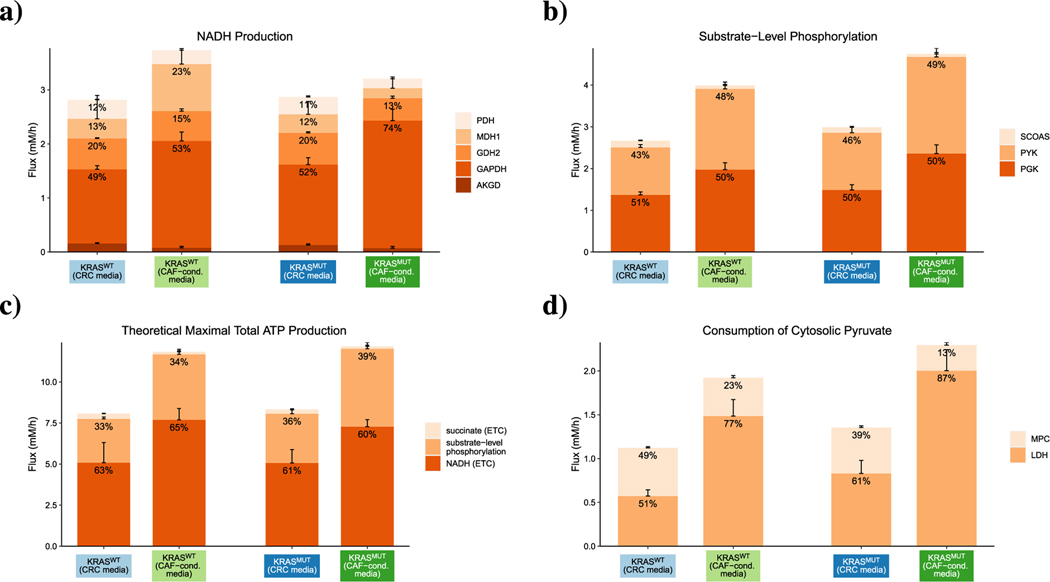
Fig. 8.
Predicted flux splits of metabolite species. a) NADH production; b) substrate-level phosphorylation; c) theoretical maximum yield of ATP; and d) cytosolic pyruvate consumption in CRC cells. The heights of the bars represent the total sums of absolute flux values. Colors represent enzyme-mediated reactions. Numbers at the top of each stacked bar represent the relative fractions of the total flux devoted to a reaction ( < 8% not shown). Error bars on top of each stacked bar represent the MADs of the fluxes.

