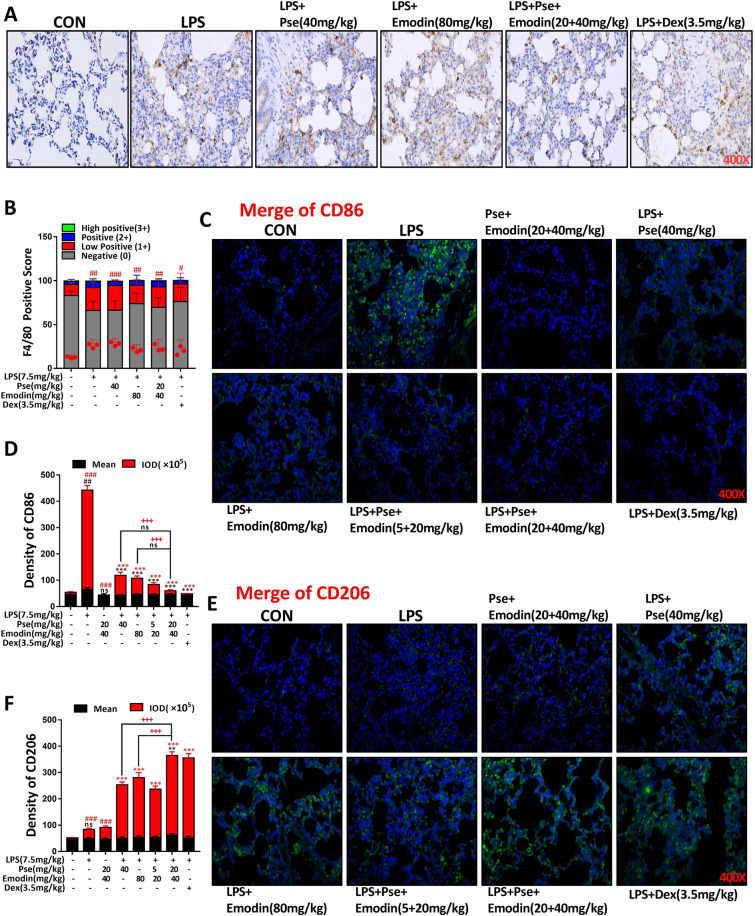
Fig. 8.
Pseudoephedrine + emodin inhibited (M1) macrophage and activated (M2) macrophage in LPS‐induced rats lung tissue. A F4/80 expression was determined using immunohistochemistry (n = 3). B F4/80 positive score was determined using ImageJ: negative (0), low positive (1+), positive (2+), high positive (3+). C–F CD86, CD206 expression was determined using immunofluorescence (n = 5). Data are expressed as mean ± S.D. ##p < 0.01, ###p < 0.001 vs. control group. **p < 0.01, ***p < 0.001 vs. LPS alone group. +++p < 0.001 vs. combined treatment group (20 + 40 mg/kg)

