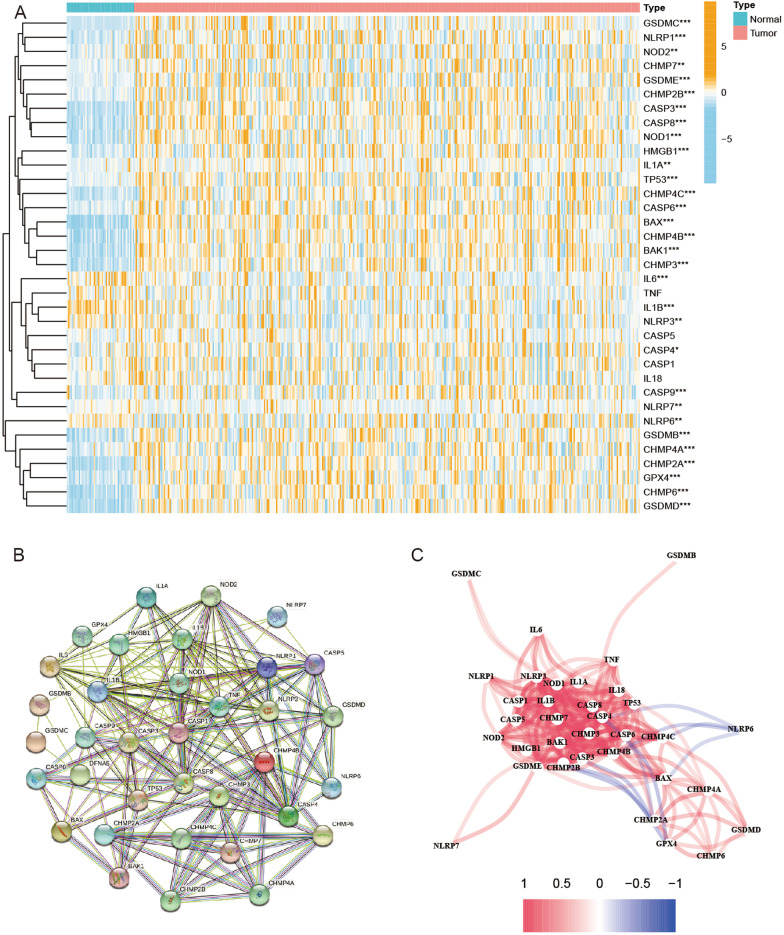
Fig. 1.
Expression of the 35 PRGs and the interactions among them. A Heatmap (blue: low expression level; orange: high expression level) of the PRGs between the nontumor (N, blue) and tumor samples (T, red). P values were shown as: **p < 0.01; ***p < 0.001. B PPI network showing the interactions of the PRGs (interaction score = 0.4). C The correlation network of the PRGs (red line: positive correlation; blue line: negative correlation. The depth of the colors reflects the strength of the relevance)

