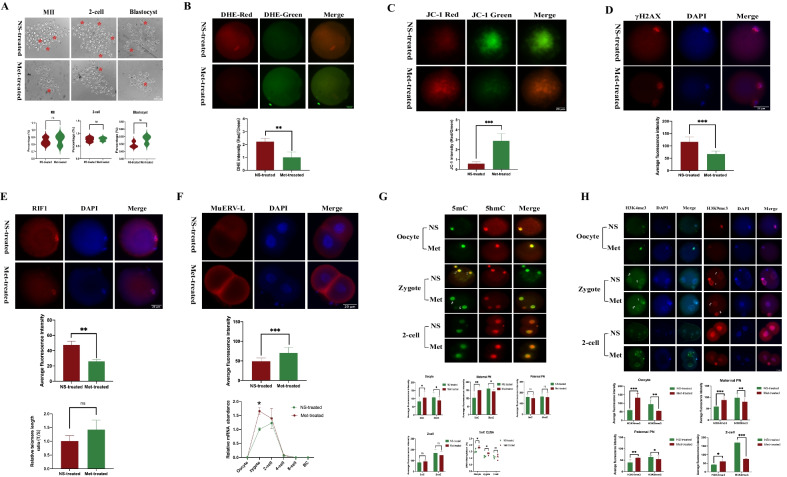
Fig. 4.
Metformin alleviated the adverse effects of HFD on oocytes and preimplantation embryos. A Developmental status captures of the oocytes and embryos in the NS-treated and Met-treated groups. Red asterisks indicate abnormal oocytes and embryos. Bottom: Statistical results of developmental status (oocytes, n = 121 for NS-treated group and n = 109 for Met-treated group; 2-cell embryos, n = 104 for NS-treated group and n = 92 for Met-treated group; blastocysts, n = 54 for NS-treated group and n = 51 for Met-treated group). B Reactive oxygen species (ROS) of MII oocytes stained with dihydroethidium (DHE) probes in the NS-treated and Met-treated groups. The red fluorescence intensity represents the level of ROS. Bottom: The statistical results are shown. C Mitochondrial membrane potential (MMP) of MII oocytes stained by JC-1 in the NS-treated and Met-treated groups. The ratios of the red/green fluorescence intensity indicated the levels of MMP. and Bottom: The statistical results are shown. D Images of γ-H2AX staining in oocytes of the NS-treated and Met-treated groups. Bottom: The statistical results are shown. E The expression of RIF1 in oocytes of the NS-treated and Met-treated groups. Top: Representative IF images. Middle: Statistical analysis results from IF. Bottom: qPCR results of the relative telomere length (RTL) of the NS-treated and Met-treated oocytes. F The expression of MuERV-L gag in the 2-cell embryos of the NS-treated and Met-treated groups. Bottom: Statistical results from IF and qPCR. G IF images of 5mC and 5hmC enrichment during ZGA between the NS-treated and Met-treated groups. The statistical diagrams and the ELISA results of 5mC are shown at the bottom. H IF images of H3K4me3 and H3K27me3 enrichment during ZGA between the NS-treated and Met-treated groups. Throughout, n = 20 in each group for IF analysis, and n = 3 in each group for qPCR analysis. Data are presented as means ± SD. P values are calculated by Student’s t test. *p < 0.05, **p < 0.01, ***p < 0.001. ns indicates not significant. Scale bars are shown in the lower right corner of the captures. NS-treated: normal saline-treated; Met-treated: metformin-treated. ♀ represents maternal pronuclear (PN). ♂ represents paternal PN

