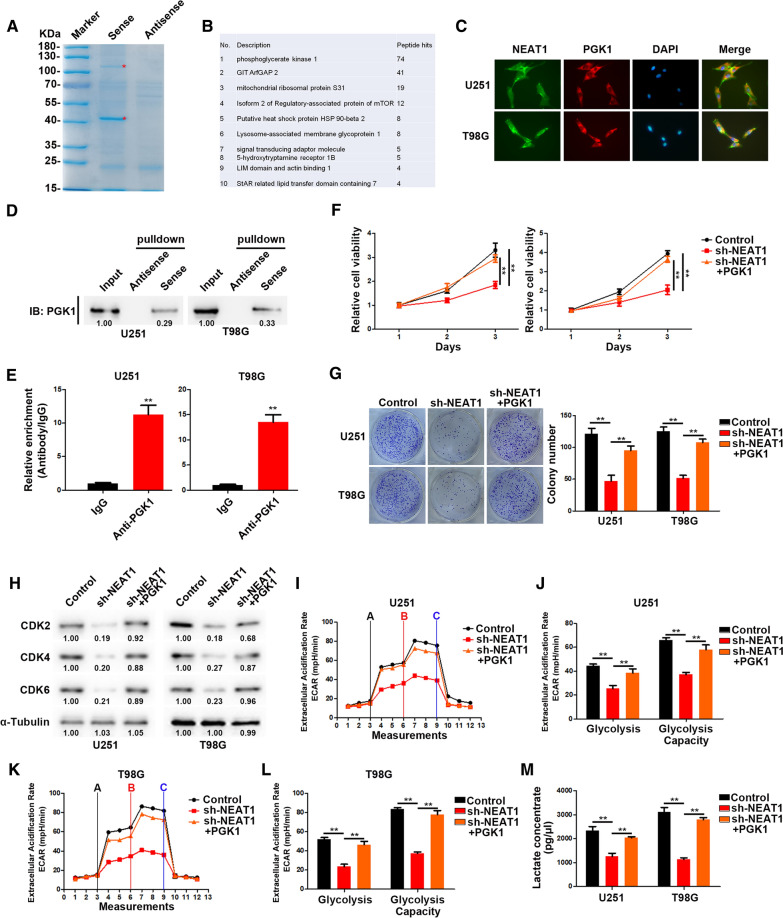
Fig. 2.
NEAT1 directly interacts with PGK1. A Coomassie brilliant blue staining of NEAT1 pulldown. Asterisks show different bands between the sense and antisense lanes. B List of the top 10 differentially expressed proteins identified by mass spectrometry. C Confocal images showing subcellular localization of NEAT1 and PGK1 in U251 and T98G cells. D NEAT1 pull-down followed by western blot exhibited the binding of NEAT1 to PGK1. E RIP assay showed the binding of NEAT1 to PGK1. F CCK-8 analysis of U251 and T98G cells transfected with sh-NEAT1 or co-transfected with sh-NEAT1 and PGK1. G Colony formation assays of U251 and T98G cells transfected with sh-NEAT1 or co-transfected with sh-NEAT1 and PGK1. H Western blot analysis of CDK2, CDK4, and CDK6 in U251 and T98G cells transfected with sh-NEAT1 or co-transfected with sh-NEAT1 and PGK1. I, J ECAR was measured through the Glycolysis Stress in U251 cells transfected with sh-NEAT1 or co-transfected with sh-NEAT1 and PGK1. K, L ECAR was measured through the Glycolysis Stress in T98G cells transfected with sh-NEAT1 or co-transfected with sh-NEAT1 and PGK1. M Lactate concentration was assessed in U251 and T98G cells transfected with sh-ctrl or sh-NEAT1. *p < 0.05, **p < 0.01. Error bars indicate mean ± SD of triple independent experiments

