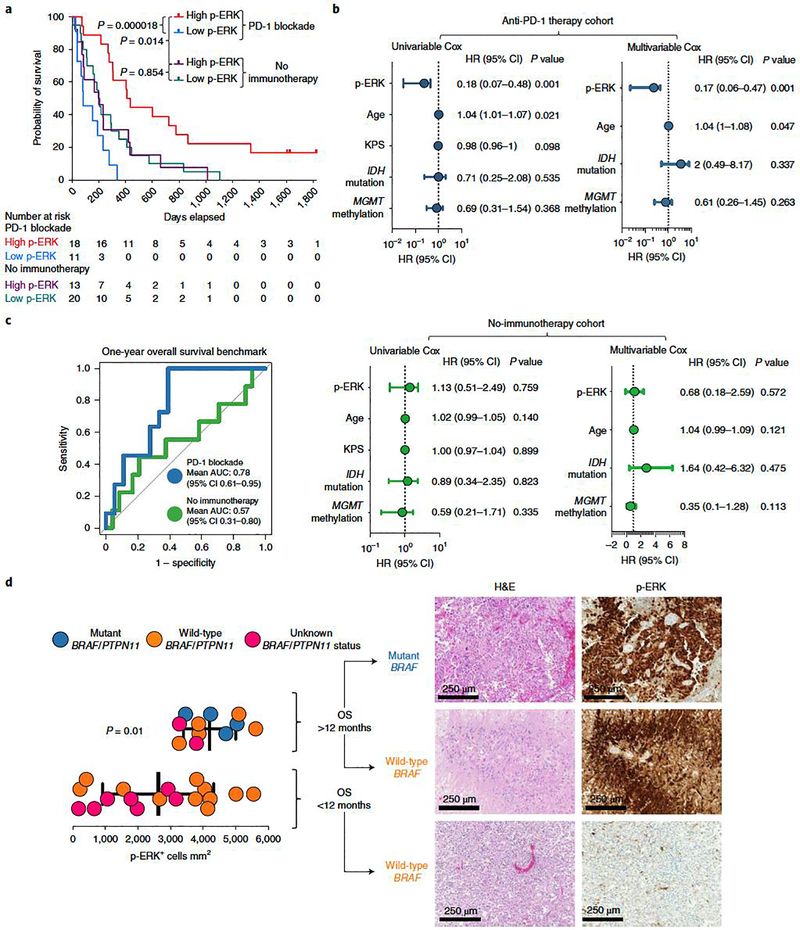
Figure 2. ERK1/2 phosphorylation evaluated by semiautomatic IHC quantification shows that is a predictive biomarker following PD-1 blockade in recurrent GBM.
a, Kaplan–Meier curve comparing OS of patients with recurrent GBM defined as having either high- or low-p-ERK tumors, counting from initiation of PD-1 blockade (anti-PD-1 therapy group, n = 29 patients) and from surgery at recurrence (no-immunotherapy group, n = 33 patients); P values, two-sided log-rank test. b, Forest plots representing univariable and multivariable survival analyses using a Cox proportional hazard model evaluating prognostic variables and p-ERK+ cell density on survival in the anti-PD-1 therapy cohort (top) and the no-immunotherapy cohort (bottom), presented as HR (95% CI). P values by two-sided Wald test. c, ROC curve of sensitivity and 1 – specificity displaying mean AUC (95% CI) for the anti-PD-1 therapy and no-immunotherapy cohorts (n values as in a) d, Left: dot plot comparing the quantification of p-ERK+ cell density between tumors of patients with GBM harboring either BRAF/PTPN11 mutations (n = 4 tumors), wild-type BRAF/PTPN11 (n = 5 tumors) or unknown BRAF/PTPN11 status (n = 2 tumors) that had OS >12 months with those that had either wild-type tumors (n = 11) or unknown BRAF/PTPN11 status (n = 7 tumors) and lived <12 months after initiation of immunotherapy. Right: H&E and p-ERK immunostaining of three GBM samples. From top to bottom: a BRAF mutated tumor and a wild-type BRAF tumor from patients that lived >12 months, and a wild-type BRAF tumor from a patient that lived <12 months. P values by two-sided Mann–Whitney U-test. Data are presented as mean ± s.d. Each dot represents an independent patient sample.

