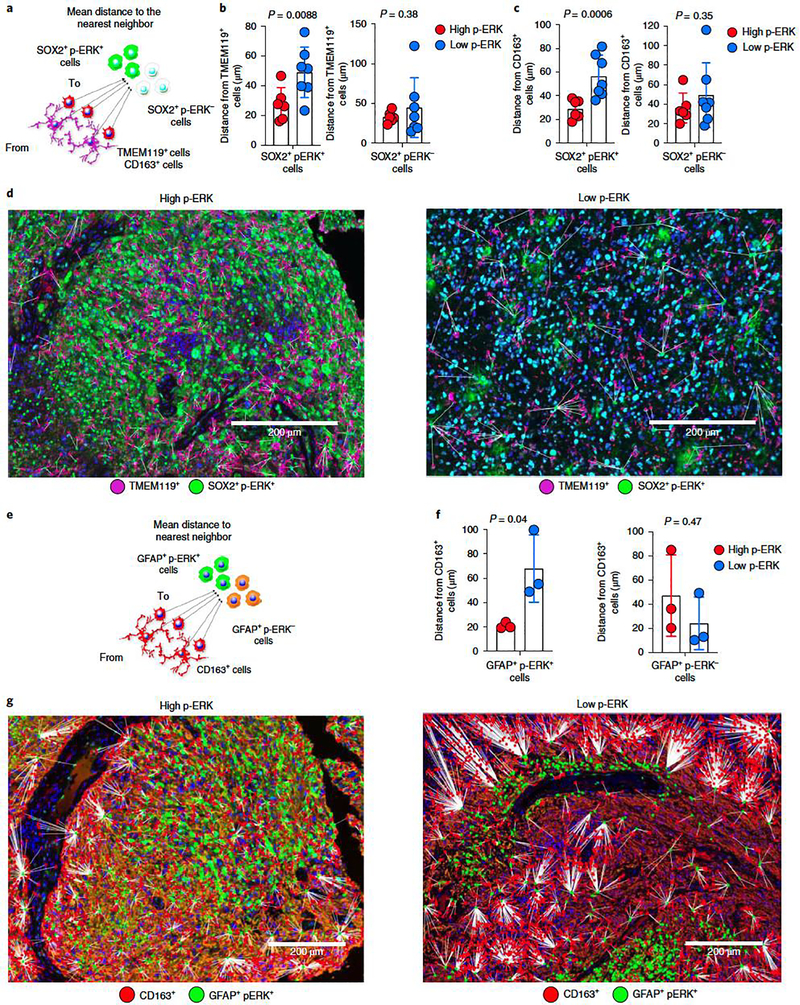
Figure 5. Spatial analysis of tumor cells expressing p-ERK and their associated myeloid cells.
a, Cartoon representing distances from TMEM119+ and CD163+ cells to SOX2+ p-ERK+/p-ERK− cells. b,c, Bar plots comparing the mean distances from TMEM119+ (b) and CD163+ (c) cells to SOX2+ p-ERK+/p-ERK− cells in high- versus low-p-ERK tumors. Dots represent tumor samples (n = 13 tumors). d, Representative multiplex immunofluorescence images illustrating spatial dimensions between TMEM119+ cells and SOX2+ p-ERK+ in a high- and a low-p-ERK GBM. The experiment was done in 13 tumor samples in one standardized run per patient. e, Cartoon representing distances from CD163+ cells to GFAP+ p-ERK+/p-ERK− cells. f, Bar plots comparing mean distances from CD163+ cells to GFAP+ p-ERK+/p-ERK− cells in high- versus low-p-ERK tumors. Dots represent tumor samples (n = 6 tumors). g, Representative multiplex immunofluorescence images illustrating spatial dimensions between CD163+ cells and GFAP+ p-ERK+ in a high- (left) and a low-p-ERK GBM (right). The experiment was performed on six tumor samples in one standardized run per patient. P values by two-tailed unpaired t-test (b,c,f). Data are presented as mean ± s.d. (b,c,f).

