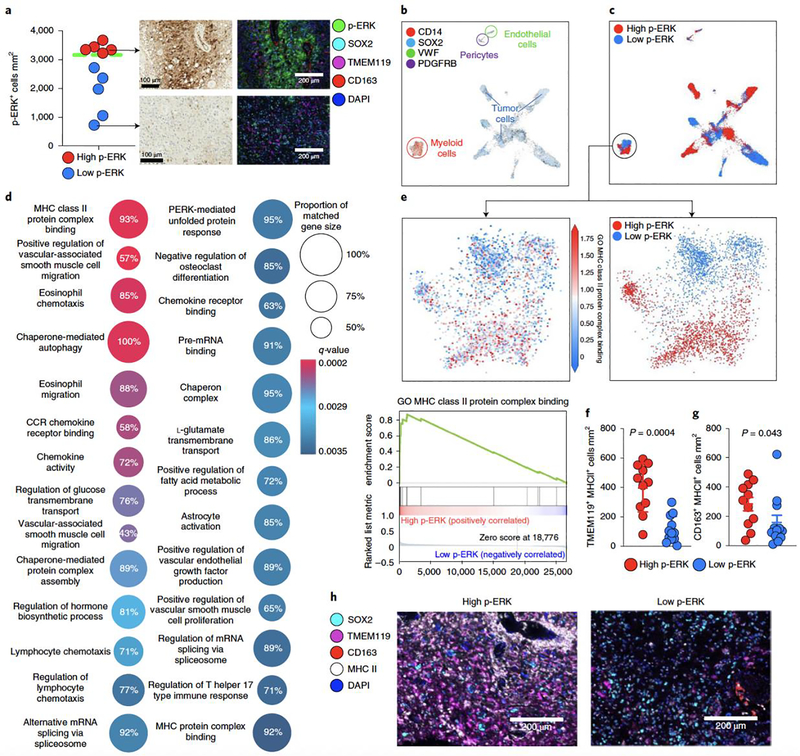
Figure 6. scRNA-seq in patients with GBM from high- and low-p-ERK groups.
a, Quantification of, and representative, p-ERK IHC images and multiplex immunofluorescence images of GBM samples used in the analysis. Dashed green line represent the cut-point value used to partition high- and low-p-ERK tumors in the discovery and validation cohorts. n = 10 tumor samples. b, UMAP graph showing the expression of cell markers for tumor cells (SOX2), myeloid cells (CD14), endothelial cells (VWF) and pericytes (PDGFRB). The color key indicates expression levels. Each dot represents an individual cell. n = 28,194 cells contained in ten tumor samples. c, UMAP graph showing the overlapping annotations derived from high- and low-p-ERK IHC-stained tumors obtained from software-based quantification in all cells (top) and in the myeloid cell compartment (bottom). d, GO terms analysis. Differentially expressed gene signatures of the myeloid cell population infiltrating high- and low-p-ERK GBM samples. Twenty-seven differentially expressed GO terms are represented in a dot plot, with dot size corresponding to the percentage of genes that matched the GO term. Dot color corresponds to the q-value of enrichment. e, Top: UMAP plot showing expression of the MHC II protein binding complex gene signature in myeloid cells. Bottom: GSEA plot showing enrichment of the GO term MHC II protein binding complex within myeloid cells. n = 3,153 myeloid cells from ten tumor samples. f,g, Beeswarm plots showing the cell density of TMEM119+ MHC II+ cells (f) and CD163+ MHC II+ cells (g) between high- and low-p-ERK tumors (n = 23). P values by two-sided Mann–Whitney U-test. h, Representative multiplex immunofluorescence images illustrating the expression of MHC II by TMEM119+ and CD163+ cells in a high- and a low-p-ERK GBM sample. SOX2, TMEM119, CD163, MHC II and DAPI are included as cell markers. The experiment was performed in 23 tumor samples in one standardized run per patient. Data presented as mean ± s.d. (f,g).

