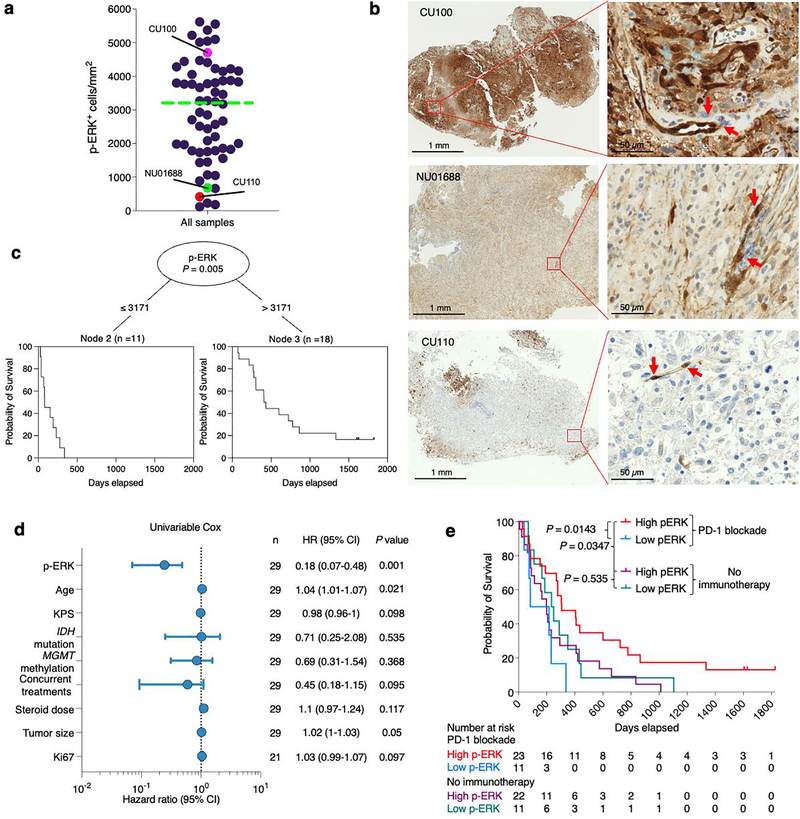
Extended Data Fig. 2 |. Quantification and cut point optimization of p-ERK+ cell density in tumoral regions.
a, Dot plot showing the distribution of p-ERK quantification of all GBM samples treated and nontreated with PD-1 blockade N = 62 tumors). b, From top to bottom, micrographs showing one high p-ERK tumor sample and two low p-ERK tumor samples with positive staining in the endothelial cells (red arrows). In the dot plot, the magenta dot represents CU100 patient, the green dot represents NU01688 patient, and the red dot represents CU110 patient. IHC images are representative of 62 independent GBM samples. c, Conditional inference trees analysis for cut-point optimization in the GBM cohort treated with PD-1 blockade reveals a cut-point value similar to the median of all tumor samples. d, Forest plot representing the univariable analysis using a Cox regression model evaluating the clinical and molecular prognostic factors that might confound the association between survival p-ERK and presented as Hazard ratio (95% CI). N = 29 GBM patients. P value by two-sided Wald test. e, Kaplan-Meier curve comparing OS of recurrent GBM patients scored as either high or low p-ERK by assessment of a neuropathologist counting from initiation of PD-1 blockade (anti-PD-1 therapy group, N = 29 GBM patients) and from surgery at recurrence (no-immunotherapy group, N = 33 GBM patients). p-ERK scores in tumor regions were designated as follows: 0–1 were considered as low, and 2–3 as high; P value by two-sided log-rank test.

