. 2021 Aug 25;27(20):5669–5680. doi: 10.1158/1078-0432.CCR-21-0312

Figure 1.

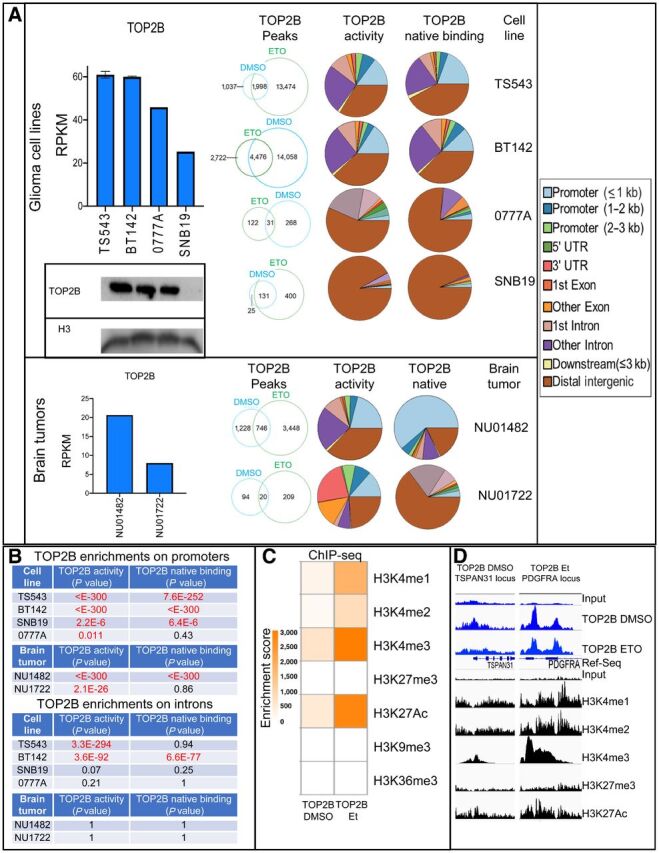
Figure 1. A, TOP2B expression determined by RNA-seq (TS543 DMSO 10 replicates, BT142 DMSO five experimental replicates, 0777A one experimental replicate, SNB19 1 experimental replicate) and Western blot on human glioma cell lines (two independent experiments on TS543, BT142, 0777A, SNB19) and human glioma specimens (NU01482, NU01722; left). Genome-wide distribution of TOP2B native binding and activity peaks determined by DMSO and etoposide (Et) ChIP-seq in different glioma cell lines were performed (top-center panel; TS543 two DMSO/etoposide experimental replicates, BT142 two DMSO/etoposide experimental replicates, 0777A 1 DMSO/etoposide experiment, SNB19 2 DMSO/etoposide experiments) and human glioma tumors (bottom-center panel; NU01482 1 DMSO/etoposide experimental replicate, NU01722 1 DMSO/etoposide experimental replicate). B, Table containing enrichment P values of TOP2B peaks for promoter and intron regions relative to random regions in the genome (Fisher exact test). C, Heatmap illustrating colocalization of histone marks with TOP2B native binding and activity peaks determined by histone marks (Fisher exact test). D, Examples of histone marks at genomic regions with TOP2B native binding (TOP2B DMSO ChIP) and TOP2B enzymatic activity (TOP2B etoposide ChIP). Same y-axis scale was used for input and for the corresponding ChIP track.

A, TOP2B expression determined by RNA-seq (TS543 DMSO 10 replicates, BT142 DMSO five experimental replicates, 0777A one experimental replicate, SNB19 1 experimental replicate) and Western blot on human glioma cell lines (two independent experiments on TS543, BT142, 0777A, SNB19) and human glioma specimens (NU01482, NU01722; left). Genome-wide distribution of TOP2B native binding and activity peaks determined by DMSO and etoposide (Et) ChIP-seq in different glioma cell lines were performed (top-center panel; TS543 two DMSO/etoposide experimental replicates, BT142 two DMSO/etoposide experimental replicates, 0777A 1 DMSO/etoposide experiment, SNB19 2 DMSO/etoposide experiments) and human glioma tumors (bottom-center panel; NU01482 1 DMSO/etoposide experimental replicate, NU01722 1 DMSO/etoposide experimental replicate). B, Table containing enrichment P values of TOP2B peaks for promoter and intron regions relative to random regions in the genome (Fisher exact test). C, Heatmap illustrating colocalization of histone marks with TOP2B native binding and activity peaks determined by histone marks (Fisher exact test). D, Examples of histone marks at genomic regions with TOP2B native binding (TOP2B DMSO ChIP) and TOP2B enzymatic activity (TOP2B etoposide ChIP). Same y-axis scale was used for input and for the corresponding ChIP track.